Gold and Mining – Trapped Investors?
February, 12 2013Precious metals are headed higher for reasons we have outlined before: intractable levels of government debt, reckless deficit spending, and worldwide money printing. GDP growth won’t be near strong enough to meet future liabilities, and neither politicians nor the public will agree to austerity measures that will be austere enough. Gold and silver will move higher as the value of currencies declines as governments attempt to pay existing and future obligations.
With that in mind, some stocks will certainly do better than others.
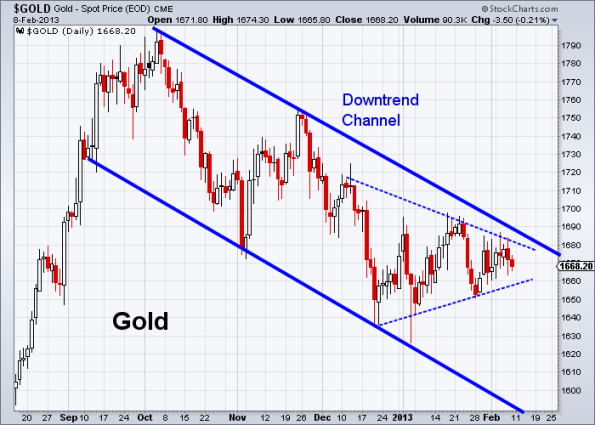
The gold index has formed a 4-month downtrend channel. Also it is forming a 2-month symmetrical triangle inside the downtrend channel. It indicates that gold currently is in sideways. We may pay attention to weakening in the strength of gold from the competitive strength between the SPX and gold.
As the weekly chart shows that the gold index has formed a 18-month Symmetrical Triangle pattern in the intermediate-term. Prices have wound around 1700. Gold could continue the sideways near this level before it breaks out from the triangle.
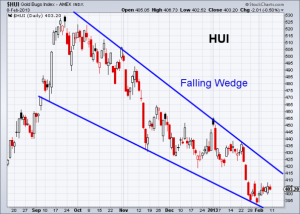
Gold/silver mining stocks are forming a 5-month falling wedge, now testing their previous early February low. They should be bearish until they break out from the upper boundary of the wedge.

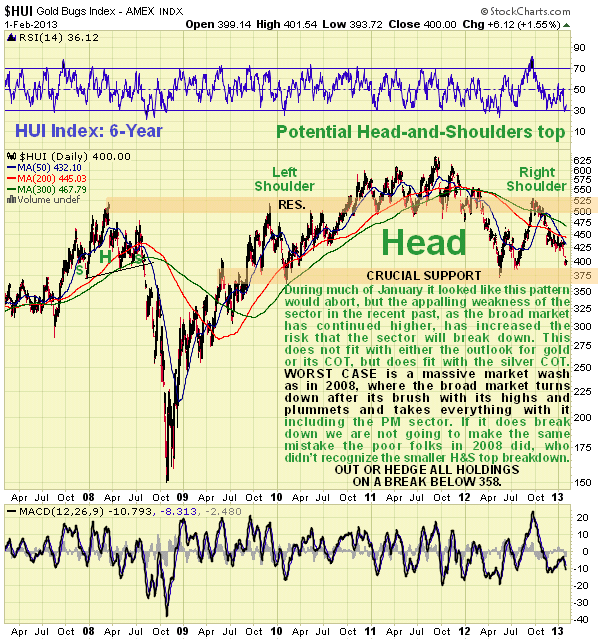
Out or hedge all holdings on a break below 358
If the outlook for gold and silver is taken to be positive, then why are Precious Metals stocks performing so terribly? – they should now be firming up if a breakout by gold and silver is looming but instead they have been plumbing new lows. The 5-year chart for the HUI index looks awful – we had earlier thought that the large Head-and-Shoulders top in this index was going to abort, but the latest weakness is increasing the risk that it is valid. If it is valid it has grave implications for the market as a whole as it targets the 100 – 150 area, and quite obviously this could only happen in circumstances of another 2008 style deflationary wash, in which case the now lofty broad market would turn tail and drop like a rock.

The head of this pattern would be very large compared to the shoulders, meaning that this formation is not very reliable. Also, if we use the 2012 low as the neck level (approximately), then the HUI Index is still considerably above it, so this formation is not in place, at least not yet. The breakdown below the 2012 low (close to the 370 level in the HUI Index) would be a very bearish technical factor, if confirmed. However, we don’t think that such a breakdown is in the cards in the coming weeks.
Stay tuned and keep your boots muddy.


