

Business Cycle & Sector Rotation Methodology
February, 22 2022
The stock market tries to anticipate the economic cycle which results in certain sectors outperforming the market at different points of that cycle.
By reversing that process, we can determine where we are in the cycles by seeing which sectors are out performing the rest of the market.
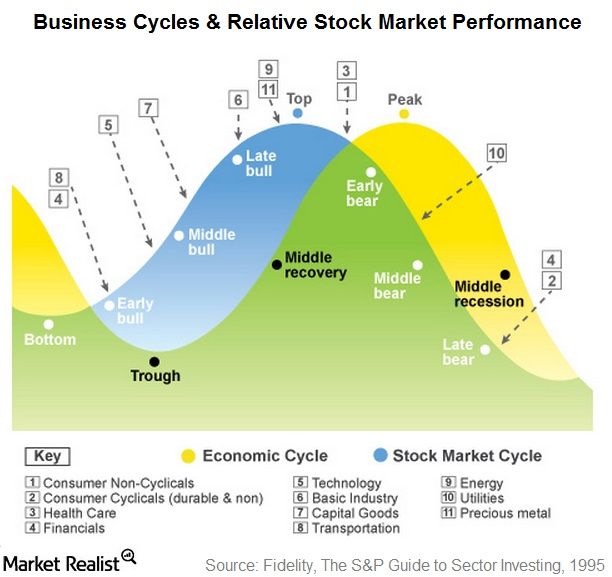
Here’s the diagram that shows those cycles and sectors:
DIAGRAM
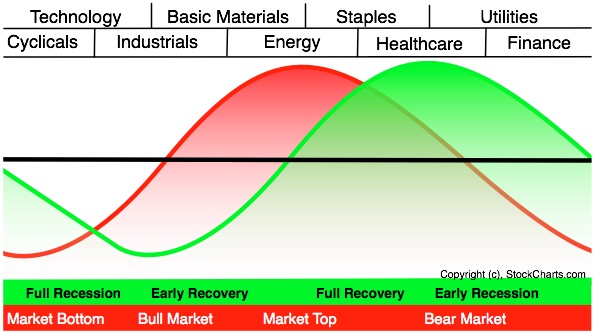
So the order – moving from Market Top to Market Bottom and back to Market Top again – is:
- Energy
- Staples
- Healthcare
- Utilities
- Finance
- Cyclicals (aka Consumer Discretionary)
- Technology
- Industrials
- Basic Materials
If you want to know where the market is going next, you need to study the relative performance of those sectors while keeping that order in mind.
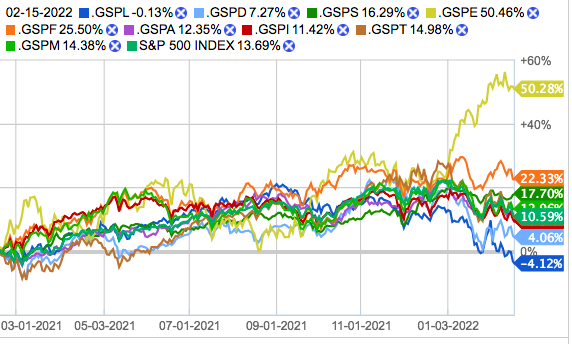
It is telling us that the three key extended mid cycle and early late cycle sectors – i.e. Energy, Financials and Materials – have outperformed the other sectors significantly in the past 3 months. Those sectors are clearly shown on this chart to be doing better that the rest. Based on this chart, we could conclude that the economy is still mired in a slowing growing environment and the stock market can be expected to head lower as a result.
Timeframe is determinant
The timeframe that you choose to look at is critical when doing Sector Rotation analysis. There are three general approaches for selecting a good timeframe:
- Choose a standard interval like 200 days. 100-days and 45-days are also commonly used as are 12-months and 6-months.
- Choose an interval with “significant” calendar-based start and end dates such as Year-to-Date, a fiscal quarter, or January 1st to June 30th.
- Choose an interval that spans “significant” changes in the market.
Notice how the sector lines appear to diverge differently after the November drop? That’s a signal to us that something may have changed and we should look at the period from then until now to see if anything did change.
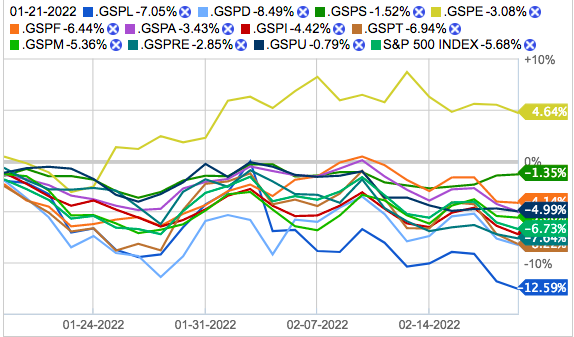
So this shows us the while Energy is still in positive territory -Financials decreasing- , they have not been as strong during the past month as they were over the previous period. Materials is the only sector to move higher. That should draw a cautious signal for the market.
Turn on the dark red Industrials line and you’ll see that it is a bit of a conundrum. It’s been relatively strong earlier this year which goes well along what our Sector Rotation model says should be happening. But lately it weakened pointing to a slowing environment and a new phase in our Sector Rotation model.
Do not forget : You – a human being – need to consider all of the evidence and decide “Is there something other than sector forces that could be causing this ‘rogue’ sector behavior?”
All of this information points to an economy that is getting under pressure but hasn’t really gotten started yet. These lines and the relationships between these sectors needs to be watched closely over the next couple of months to see if more signs of recovery appear or to see if things regress.
Stay Tuned
+ Kondratieff (TBD)