Market Wrap as of May 5
May, 06 2014Tout va tres bien Madame la Marquise
 Although the Fed’s continuing reduction in its policy accommodation had an important (if arguably perverse) confidence- building effect on markets, its guidance that administered rates will be kept low for a long time were an even greater reassurance. Indeed, the Fed has made quite clear that it intends to leave policy highly stimulative even after the economy is able to sustain solid growth at or above 3.0% to ensure that the still substantial slack is fully wrung out of the labor market. Specifically, the Fed continues to signal that rate hikes are a considerable way off. Moreover, even after hikes begin (probably not until the summer of 2015), tightening will be very gradual and administered rates will likely be left below normal (around 4.00%) for years to come.
Eurozone: The Recovery Continues
The Markit Eurozone Manufacturing PMI rose 0.4 to 53.4 in April; every nation reported growth. This is the index’s 10th consecutive month above 50. The Eurozone March unemployment rate was stable at 11.8%. Portugal formally exited from its “Troika” bailout.
In Japan and China
Japan:The impact of the April 1 tax hike showed up in consumer behavior, although the Bank of Japan (BOJ) isn’t blinking. The Bank of Japan cut its FY14 GDP forecast from 1.4% to 1.1% and reaffirmed its goal of driving inflation to 2%, and left policy unchanged for now
China: More evidence of slowing growth, as manufacturing rose 0.1 points to 50.4 in March. The World Bank estimated that China is about to overtake the U.S. as the world’s biggest economy, although it is still a relatively poor country on a per-capita income basis.
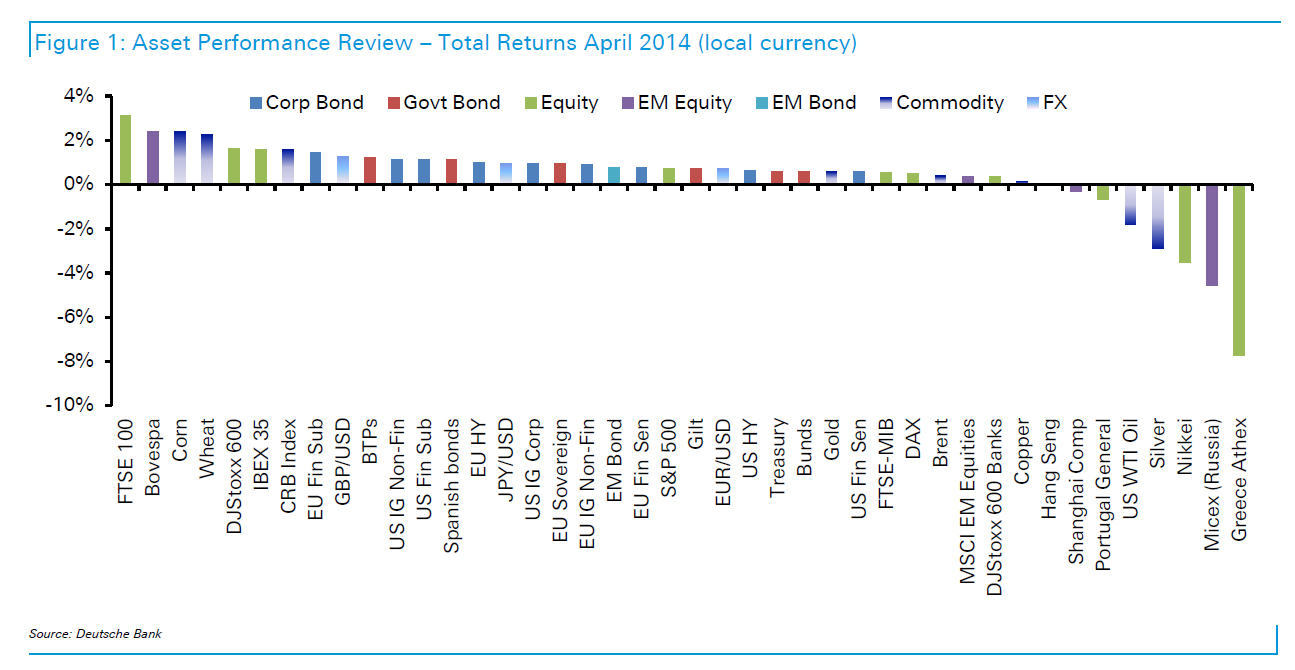
Equities: In spite of some data disappointments along with unsettling instability in Ukraine, equities were broadly bid across the G7 this week. In contrast, Australian stocks were lower perhaps reflecting concern over big exposure to the still slowing Chinese economy. Emerging market equities show less traction with Russia under particular pressure from sanctions.
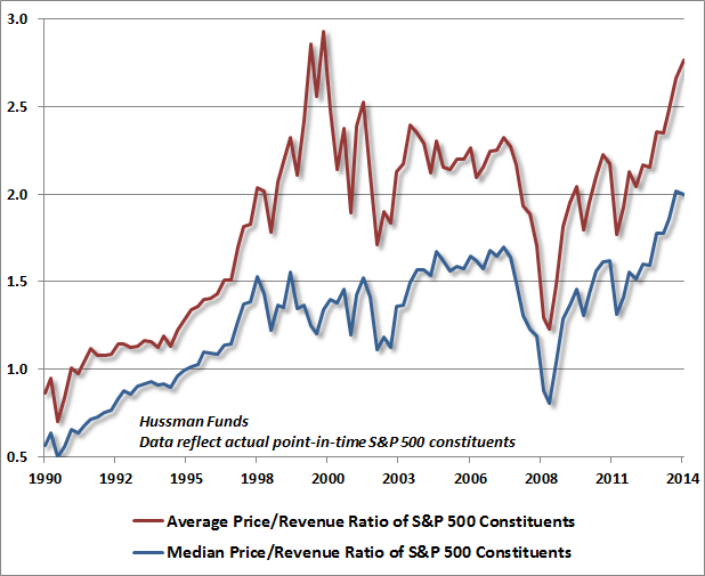
With equities near highs yet the weakness in growth, one would expect valuations to be stretched. They are. The average price/sales ratio for SPX is now approaching that from the 2000 bubble; it is already well above the levels from 2007 (chart from Hussman Funds). A further revaluation higher is unlikely to be a tailwind for equity prices.
Bonds: G7 government bonds were mostly bid, reassured by the Fed’s low for long signal. Gilts were the notable exception this week as another strong UK GDP report, along with soaring consumer confidence and home prices, reinforced speculation that the Bank of England will likely be one of the first major central banks to begin raising administered rates.
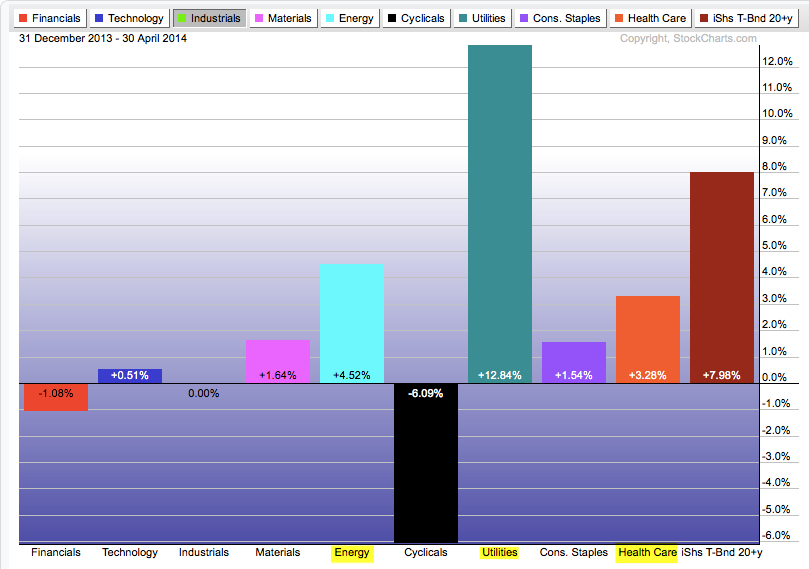
Finally, consider the performance of treasuries this year. In the first 4 months of the year, a bond portfolio has outperformed equities by over 800bp. The only equity sector comparable to bonds has been yield producing utilities. Growth stocks have been crushed.
This outperformance has come as the Fed has vocalized its intention of reducing its stimulus program. Yields have fallen now as they did each of the prior times QE was suspended. Why? Yields reflect growth expectations: less stimulus implies lower growth and therefore lower yields. No one should have been surprised by this, yet investors of all stripes have been massively underweight income (chart from Bespoke).
Currencies: GBP remained bid, rising to its highest since August 2009. Again, upbeat activity data highlighted the likelihood that the BoE will be among the first to begin tightening. EUR is also remains strong as investors bet that the ECB could pass on easing next week. Indeed, in comments over the last week ECB President Draghi appeared to suggest that quantitative easing was not imminent.
Commodities: Crude oil prices were lower this week on a combination of data further validating the slowdown in China’s economy and the persisting build in US inventories, which stretched to yet another record high. These factors swamped any pressures to the upside associated with fears of potential supply disruptions from a further escalation of the Russia/Ukraine crisis.
The Great(est Fool) Rotation: Who’s Buying, And Who’s Selling?
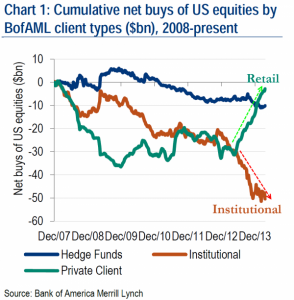
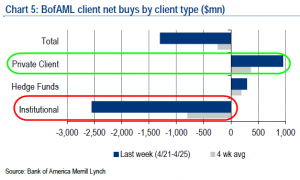
We could yarn on for hundreds of words discussing the ins and outs of falling volumes and record-er highs in US equity markets as Treasury bond yields collapse, macro- and micro-fundamental data slumps, and the total nonsense with regard to ‘cash on the balance sheets’ when it is all levered to the max. But when it comes to showing just who is buying the hope… and who is selling the hype, the following chart from BofAML sums it all up… institutional clients sold the most since January and the 4th most on record in the last week as retail clients continued their buying streak.
Institutional clients are dumping equities off to retail clients… thank you very much…
Last week, during which the S&P 500 was down 0.1%, BofAML clients were net sellers of $1.5bn of US stocks following a week of net buying.
Net sales were chiefly due to institutional clients, who have now sold stocks for the last five consecutive weeks and are the biggest net sellers year-to-date. Net sales by this group last week were their largest since January and the fourth-largest in our data history (since 2008).
Hedge funds were net buyers for the fourth consecutive week, and private clients also continued their net buying streak.


