

MARKETSCOPE : A Magnificent Decline
October, 30 2023
Market Is Shooting The Generals

How many will survive ?
Before we improve artificial intelligence, can we work on human stupidity !?
It was another highly volatile week for the market, due to poor corporate results, most of which were severely punished. The main driver of Wall Street’s retreat this week was a slide in megacap technology stocks.
A big component of the problem is the steady deflation of the hype around artificial intelligence. According to a trusty measure produced by one of the Magnificent Seven, Google Trends, search interest in artificial intelligence spiked after the launch of ChatGPT last November. Before that, AI had been generating no more search interest than it had in 2004. That level of interest, always unsustainable, has dropped significantly.
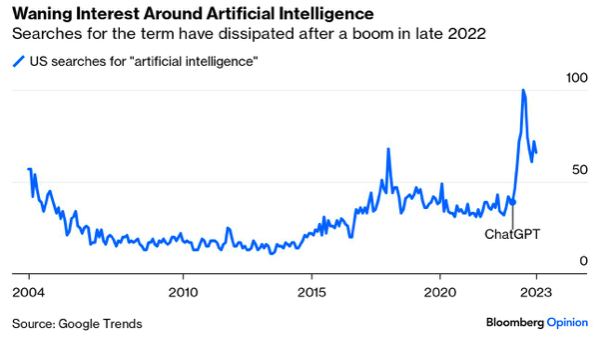
Source Bloomberg Opinion, John Authers
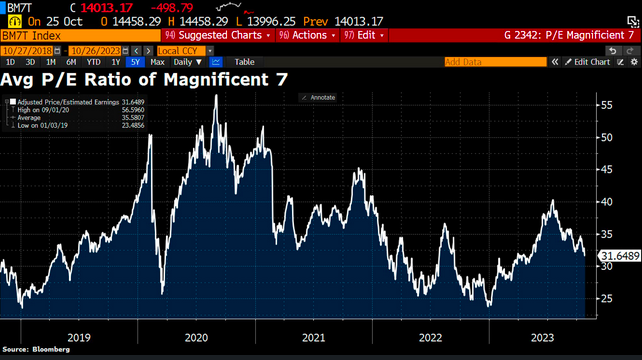
All it took was a cold blast of reality from earnings season to thwart the relentless optimism that has been powering the Magnificent Seven, the biggest stocks in the S&P 500 by market capitalization. While their earnings were not too disappointing, the hopes hinging on the prospective growth of the big internet platform companies look to have left these firms vulnerable to the slightest disappointment.
The carnage the handful of stocks have seen post earnings, was about $386 billion off their market value vanishing (Bloomberg). So large is the loss that the decline has brought the S&P 500 down 10 % from its recent peak, almost reaching the popular definition of a correction.
Microsoft’s awesome third-quarter report was overshadowed by a miss at Google’s cloud revenue. Meta’s fantastic third-quarter report was muted by commentary about some advertising weakness in the current quarter, while Amazon’s strong and better-than-expected free cash flow performance in its third-quarter report was overshadowed by broad-based concerns about the retail economic environment. All of this just doesn’t bode well for Apple, which is scheduled to report this week.
But it’s not just earnings. Tech stocks entered this year with the odds stacked against them thanks to the aggressive Federal Reserve. Long-term Treasury yields provide the rate for discounting companies’ future cash flows, so a higher discount rate will lead to lower valuations. This should be particularly true for stocks expected to deliver a lot of growth long into the future. It was remarkable that the Magnificent Seven had progressed so far with such headwinds.
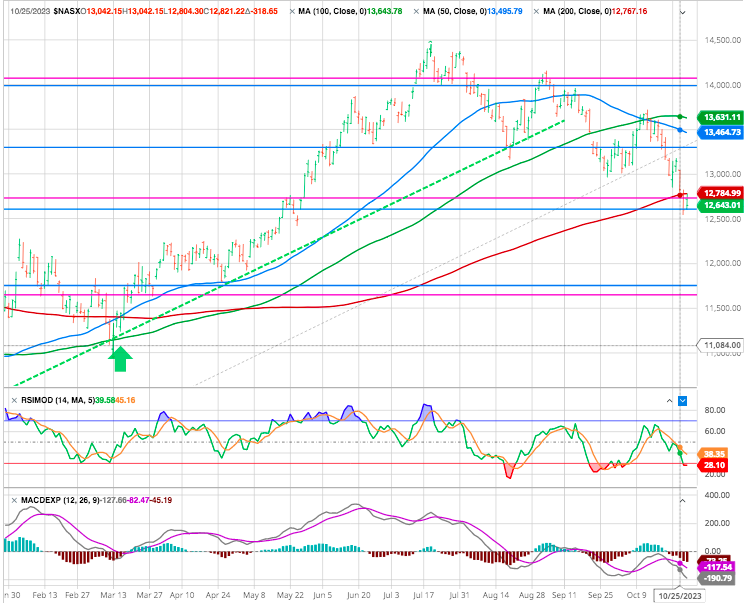
 US equities indices finished lower for a 2nd straight week, as market sentiment was dented by mixed corporate earnings reports, geopolitical tensions and concerns about rising bond yields. The S&P 500 retreated 2.53% for the week to close at 4,117.37 points, posting losses in four out of five sessions. The benchmark gauge’s slide pushed it into correction territory, with Friday’s closing price marking a more-than-10% drop from the S&P’s 52-week closing high of 4,588.96 points notched on July 31. That comes just two days after the Nasdaq Composite also entered correction territory. Ten of the 11 S&P sectors ended in the red.
The very good set of data for the US economy was an additional burden, suggesting that the Fed will have to raise rates again. The US 10-year yield remains stuck near its highs at 5% after crossing the 5% threshold on Monday, it moved lower and traded around 4.8% at the end of the week. We keep the 5.26/5.33 zone in mind as a potential inflection point from which rate easing is likely (or at least strongly expected).
The STOXX Europe 600 Index ended 0.96% lower. As expected, ECB left rates unchanged. Equities in China rose as an improvement in industrial profits suggested that the economy may be stabilizing.
The latest statistics from the United States do not support the market’s expectations: deflated PCE came in higher than forecast on a monthly basis, and the resilience of personal spending brings support to the thesis of a soft landing for the US economy.
All suggest that the Fed’s job is far from finished and more work will need to be done.However Jay Powell, due to speak on Thursday, could deliver a message that shifts the heavy lifting of bringing inflation down from the Fed to the market.
Investors have a busy week ahead, with a trio of central banks: Japan on Tuesday, the United States on Wednesday and the United Kingdom on Thursday. The Fed is widely expected to leave the target federal funds rate unchanged at 5.25%-5.5%. Also activity indicators (China’s “official” PMI on Tuesday and Caixin on Wednesday). Not to mention the monthly US employment report on Friday.
The corporate calendar is not to be outdone, with quarterly results from McDonald’s, HSBC, Stellantis, Qualcomm, Airbnb, Shell, AXA, as well as the world’s largest capitalization Apple, and the two healthcare stars, Novo Nordisk and Eli Lilly. Plus a host of others, of course.
MARKETS : BOOM… and DOOM !
Here’s a look at the four 10%+ corrections we’ve had in the last two years. Just registered a 4th last week. How deep will this one end up being?
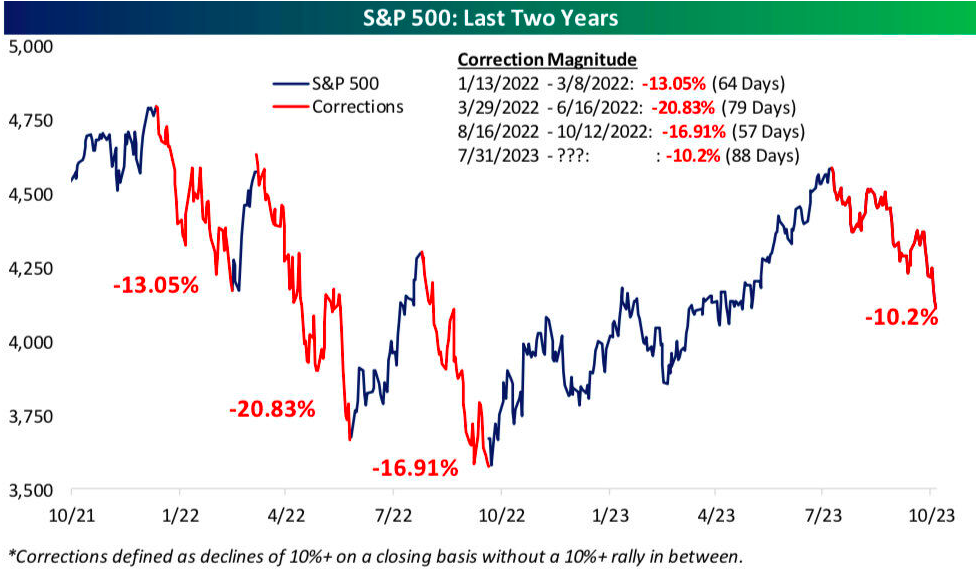
Source Bespoke
Right now, investors are staring down a cap-weighted market that has broken through its uptrend to the downside, while it has also broken through to the downside its 200 day moving average (see image below) and the 200-day breadth indicator also continues to deteriorate (which goes to show that the weakness is increasingly broad-based).
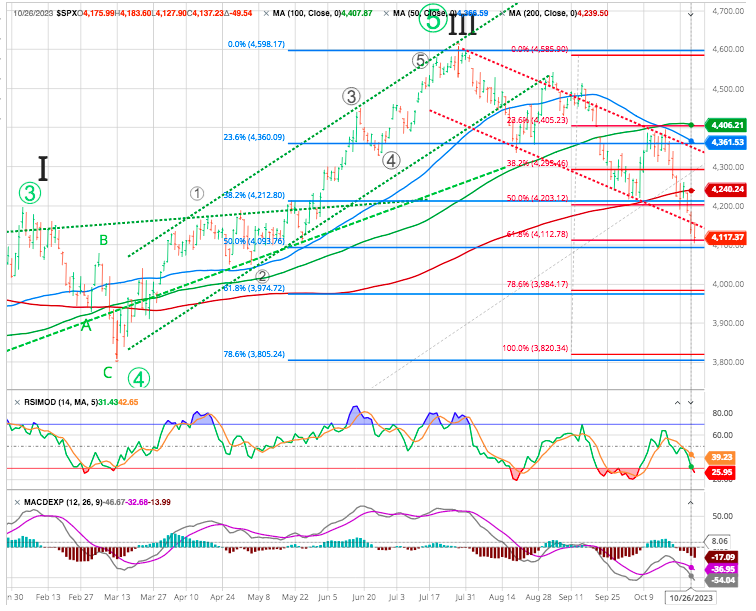
The market is approaching deep oversold conditions with some minor support around 4100 and the 61.8 % Fibo (red) correction of the last up wave as well as a 50 % retracement (Blue) from the October low. From a technical standpoint, we likely need a washout lower with some capitulation before the markets can start moving higher again. A 61.8 % correction target sat 3970 -See Fibonaci sequences and Elliott waves development in the next section-.
NASDAQ
The alternate view to those bearish takes would be that the market simply follows the seasonal script of strength into year-end.
Some of the logic or psychology behind this pattern is market participants remain encouraged and greedy from the H1 gains, and the resultant bullish bias sees the crowd ready to jump back on the bandwagon at a moment’s notice. But it is too soon to speak of a possible Christmas rally.
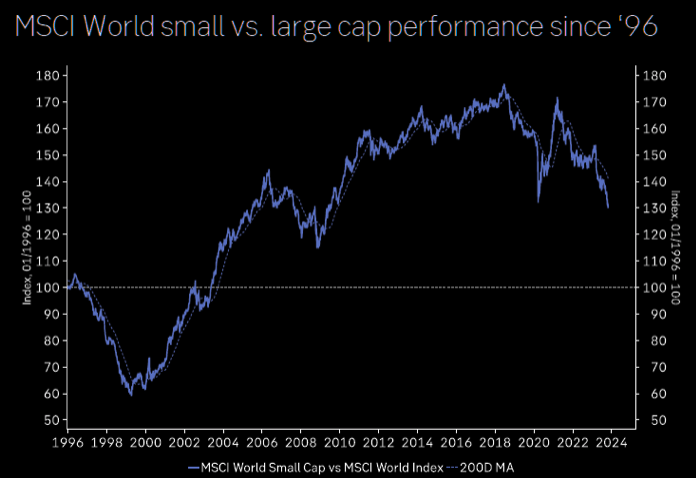
Small cap has underperformed large cap by more than 10% in ‘23, testing decade lows.
Gold $2,000
$2,000 appears to be a key price level that gold’s been grappling with (see Gold can’t conquer $2,000 chart below). Over the past 3 years, there have been 3 instances of gold rising slightly above $2,000, only to quickly drop below that price level. Recent world events have pushed gold prices back near $2,000, but as of late October, gold has yet to climb above that level.
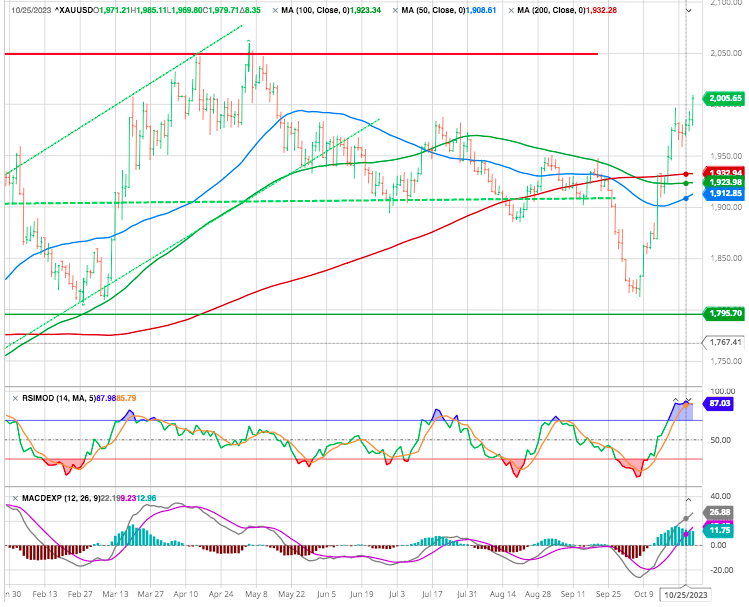
While the gold market is certainly overbought from the low to high October rally, flight to quality uncertainty looks to entrench in the marketplace [as world events unfold]. But it is rates that gold investors may want to closely monitor. The biggest threat to gold and silver bulls might be higher US Treasury yields.
Crypto:
Despite rising scrutiny on the role of cryptocurrency in financing terror in the wake of the Oct. 7 attack by Hamas on Israel, bitcoin soared.
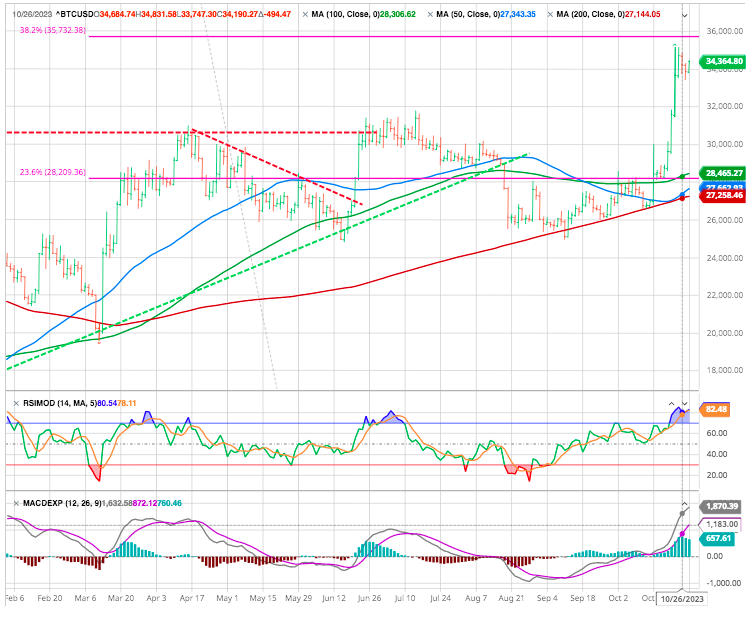
Buoyed by speculation surrounding the imminent launch of a Bitcoin Spot ETF in the US, bitcoin has soared by more 30% in the past two weeks, returning to close to $35,000. While the launch of such a bitcoin-backed exchange-traded product would enable a good number of investors to gain direct exposure to the digital currency via their traditional portfolios, there’s nothing to suggest that they’ll be rushing out in droves to own it.
Keep an eye on commodities
The impact of commodity prices is always an important factor for investors across asset classes to consider. Typically, commodity prices are broadly influenced by the business cycle , but recent events around the world may exert a greater influence on some key commodities for the foreseeable future.
Recession in 2024
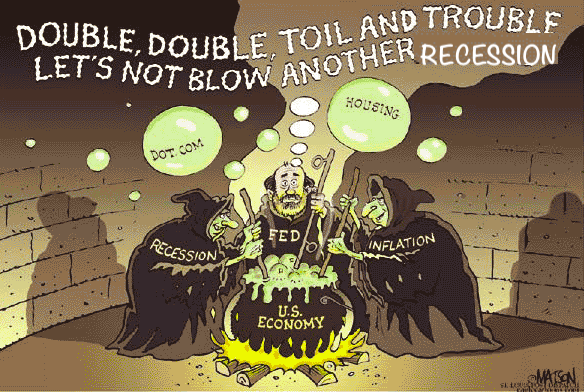
There may also be some macroeconomic concerns that could be weighing on the markets, too. Many economists continue to forecast a recession at some point in the coming quarters, something they have been doing for the better part of a year yet, with the economy still holding up thanks to a resilient job market.
On the contrary, following the September FOMC meeting, the Federal Reserve reiterated its “higher for longer” mantra and upgraded its economic forecast to include a “no recession” scenario.
As noted by WSJ “Fueling the optimism are three key factors: inflation continuing to decline, a Federal Reserve that is done raising interest rates, and a robust labor market and economic growth that have outperformed expectations.”
The problem with that optimism is that it is entirely based on lagging economic data.
But how is a “no recession” outcome possible amid the most aggressive rate hiking campaign in history, deeply inverted yield curves, and other measures warning of its inevitability?
US borrowing costs are soaring, and US treasury demand insurance is up. There has been a lot of upward pressure on rates, mainly from an expanding term premium. At the end of the day, markets are about confidence. If US debt continues losing buyers’ confidence, even due to building geopolitical tensions and not genuine economic concerns, this could be a significant risk to our economy and global markets.
Furthermore, tighter monetary policy’s “lag effect” is still working through the system.
Today, we are seeing many of the early warning signs : Leading economic indicators, inverted yield curves, and the change in monetary velocity they suggest that it shouldn’t be surprising to see the economy slow over the next few months and bring recession risk back on the table for 2024, or worse, stagflation risk.
Fibonacci sequences and Elliott wave theory
see our highlight here
Should the market see a sustained break of the 4165 level, and continues down to the 4060-4100 area, then we have no choice but to view this decline as wave 1 of the 5-wave c-wave pointing us down to the 2900-3300 range as we look towards 2024.
Therefore, as long as we hold the 4000-4100 support, then it is reasonable to expect a 2nd wave counter-trend rally back to the 4375-4475 range before wave 3 begins to take us down in earnest into 2024.
Now any durable market’s drop below the 4100 target, it will provided an environment that can set up a market crash which would point down to the 2900-3300 area before another multi-year bear market rally begins.
Happy trades
BONUS
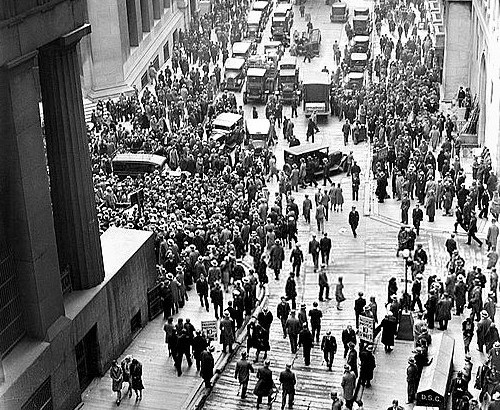
Remember Black Tuesday:
October 29th, 1929, better known in the history book as “Black Tuesday,” followed closely on the heels of Black Thursday, not even a week before. Black Thursday, or October 24th, 1929, was a day of panic in the market as the Dow Jones Industrial Average shed approximately 11% of its value. Despite efforts to glue the market back together in a hurry, it further off the cliff the following Tuesday as the Dow plummeted another 12%, leading to a total collapse. The collapse was, of course, catastrophic as many lost their life savings or fortunes. After nearly a decade of gains, it all came to an end in a matter of days after the panic and market crash of Black Thursday and Tuesday in October 1929. The ensuing period of economic hardship marked a new chapter of hardship in American history.
Source Bespoke