

MARKETSCOPE : Be Aware. Be prepared !
June, 24 2024
MOJO

If macroeconomic statistics are anything to go by, they would point to a negative trend: for the past few weeks, economists’ expectations have almost invariably been over-optimistic, particularly in the USA. Investors aren’t necessarily complaining, because this reinforces the scenario of a rate-cutting cycle on the part of Western central banks.
SNB Surprises The Market (Again)
As John Authers noted “Maybe it’s appropriate that Switzerland has honored its most famous peak by tracing the Matterhorn, making its second cut Thursday after the first in March. And nobody is following along.”
The Swiss National Bank has clearly pivoted, lowering its key rates for the second time in a row, notably to calm the ardor of its currency which, as a safe haven, is benefiting from the uncertain political climate currently prevailing in Europe. The Swiss policy rate stands at 1.25%.
While the Fed has every intention of returning to a more accommodative stance, it has to be said that some of its peers are also struggling to find encouraging evidence in the inflation figures. Australian, Norwegian and British central banks prefer to adopt a wait-and-see stance, while the ECB, after cutting rates by a quarter-point at the beginning of the month, plans to take its time before moving forward.
Fresh new all-time highs for the S&P 500
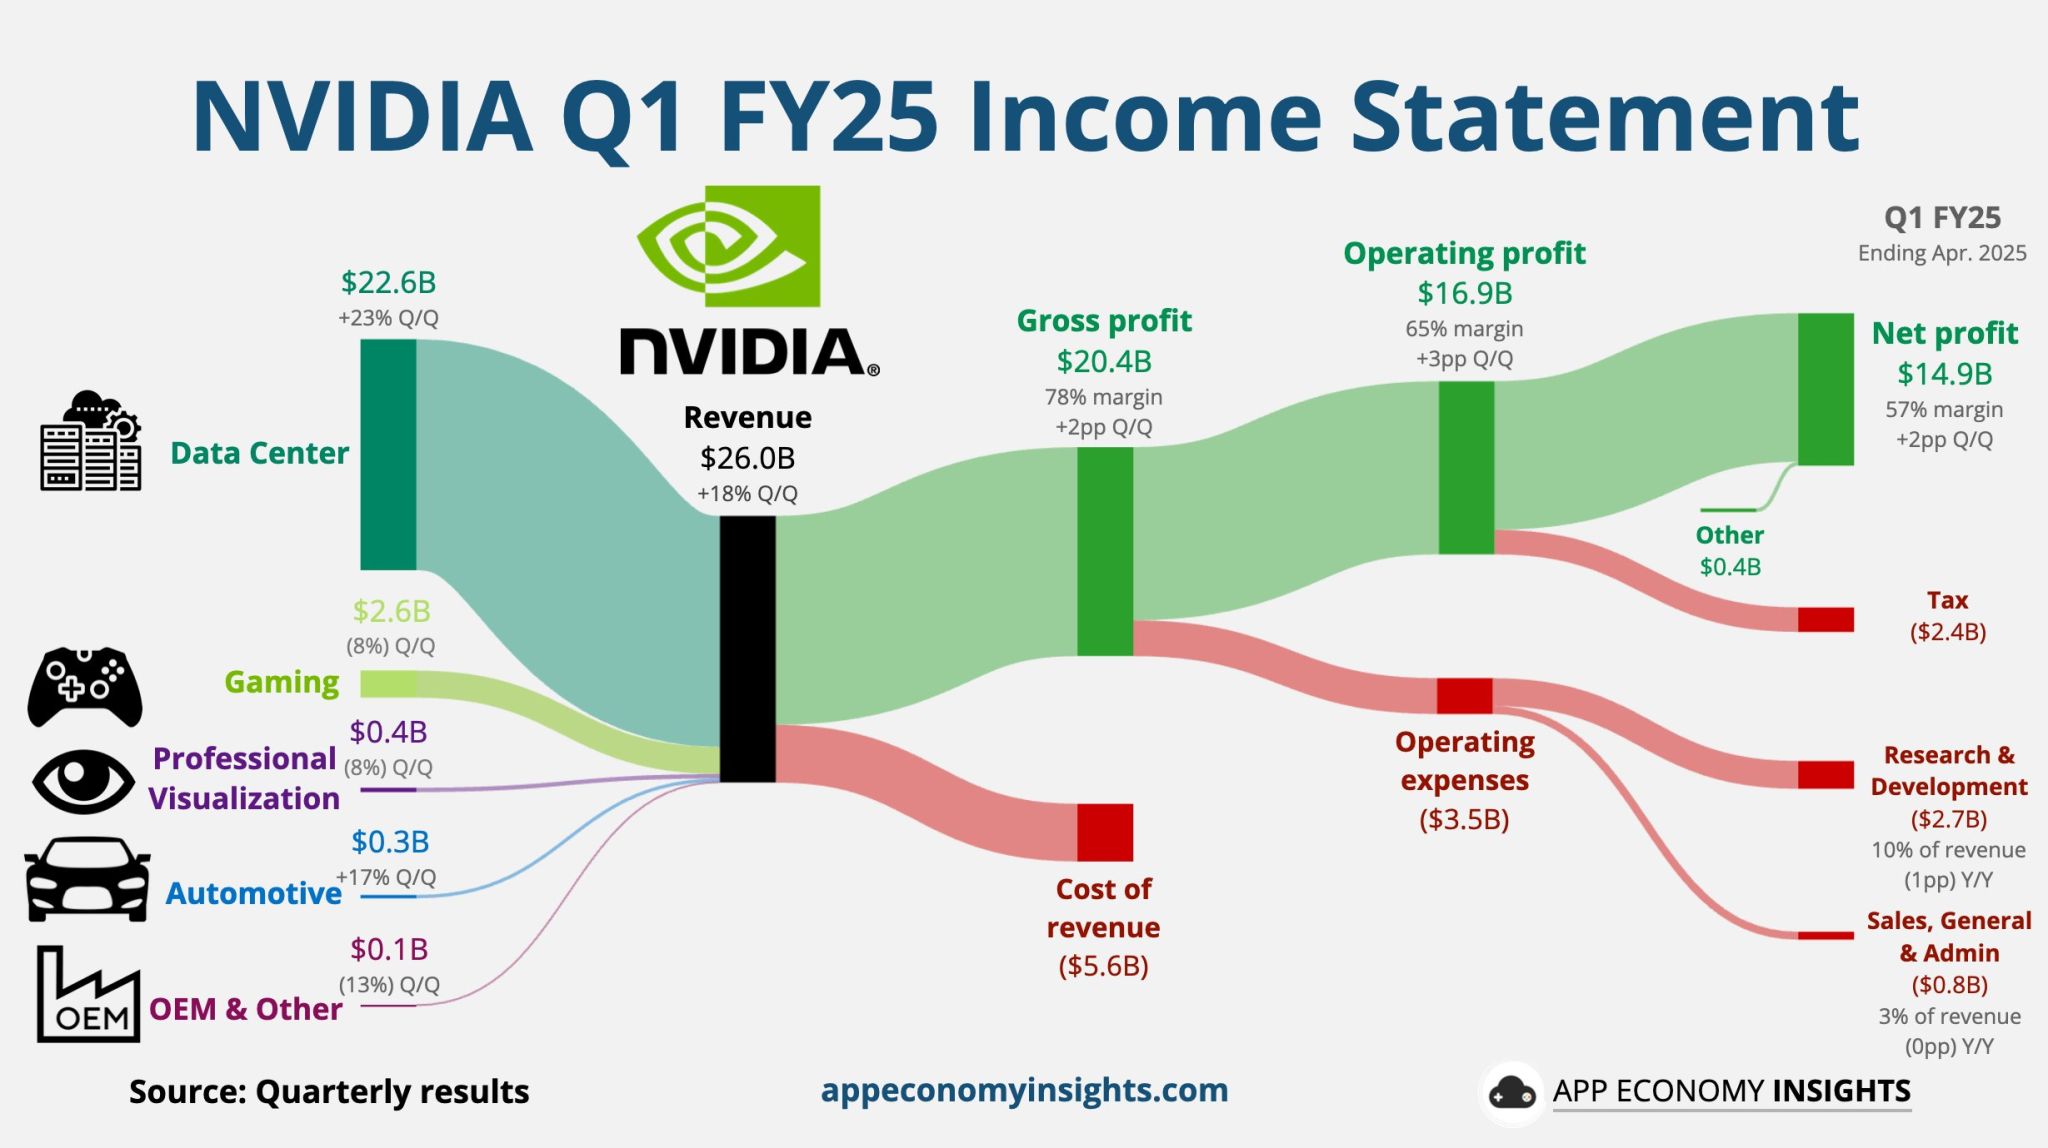
Stock markets recorded modest gains over the shortened trading week (US markets were closed on Wednesday), with the S&P500 hitting 5,500 intraday for the 1st time ever. The week also saw modest signs of rotation in the market, with the risk of further major sell-offs, especially as US technology stocks showed some signs of weakness at the end of the week. Value stocks outperformed growth as Nvidia suffered its first down-week in two months as the chipmaker is becoming the world’s largest publicly listed firm by market capitalization (see below).
STOXX Europe 600 Index ended 0.79% higher, rebounding despite worries about political uncertainty and while private sector business activity unexpectedly slowed in June as services lost momentum and manufacturing contracted more sharply than expected.
NEXT
Inflation will take the spotlight next week, with market participants looking ahead to Friday’s U.S. personal income and outlays data for May. That report will contain a reading on the core personal consumption expenditures (PCE) price index, which is widely seen as the Federal Reserve’s preferred inflation gauge.
MARKETS : Catch Me If You Can!

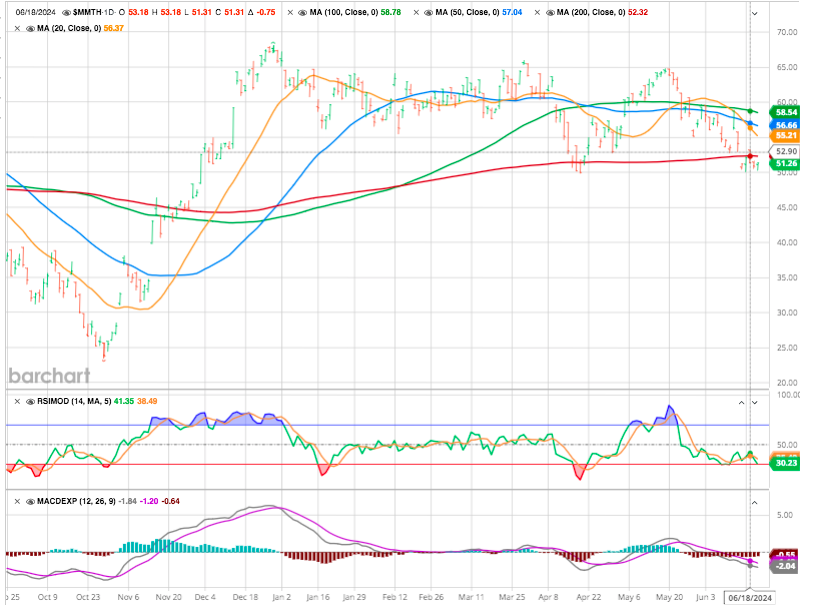
Market breadth is weakening, with fewer stocks making new highs and more making new lows. The chart below more appropriately represents the “bad breadth” issue, comparing the S&P 500 to the number of stocks trading above their 200-DMAs. Despite the market advance, the number of stocks above their respective moving averages has declined since April.
Despite some “technical warnings” that we need to investigate further, it is essential not to overreact to these warnings because the current bullish momentum and exuberance can keep markets elevated for far longer than logic would presume.
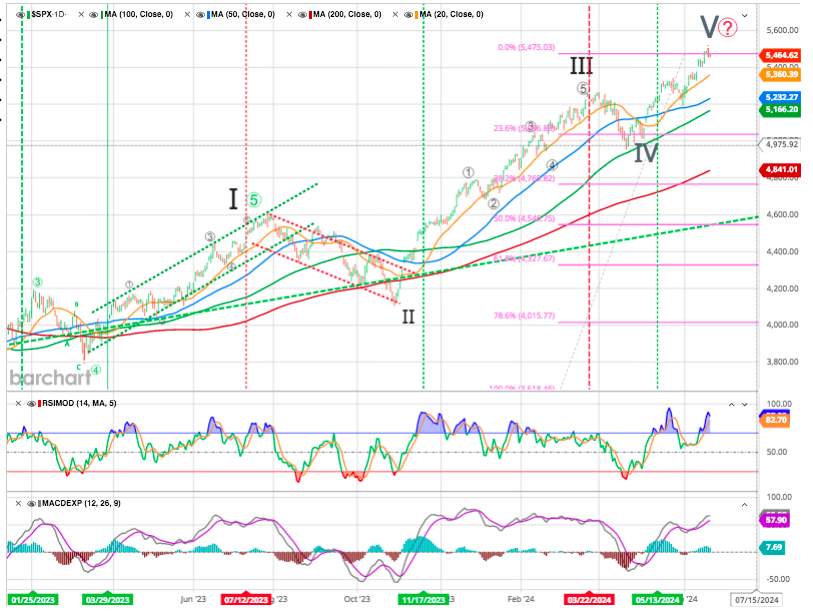
That unstoppable advance, driven by the mega-capitalization stocks. With the strong momentum carrying that particular group of stocks, the index will likely try to push higher over the next few days. However, bullish sentiment on the high tech has reached ‘greed.‘”
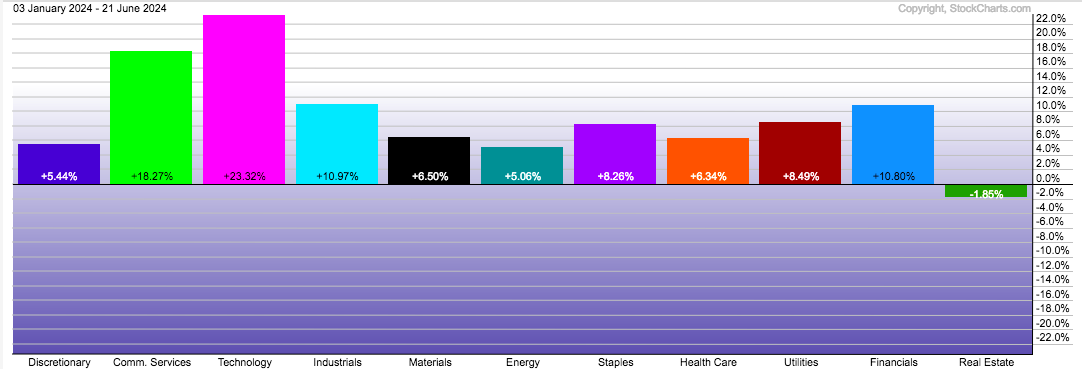
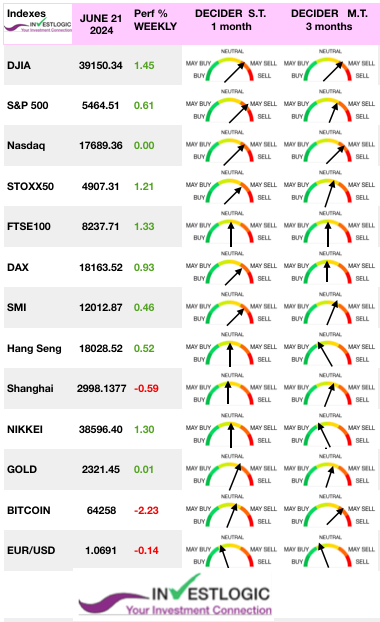
absolute perf
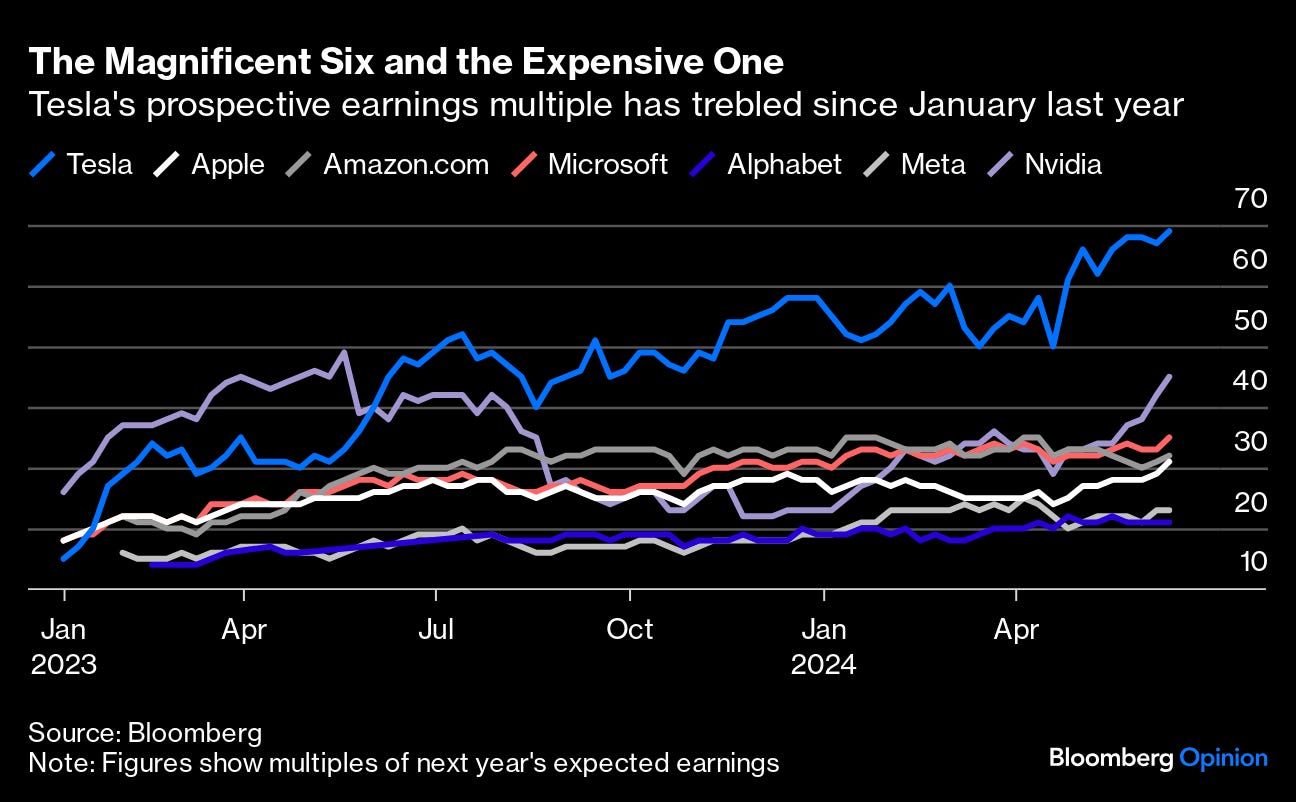
Momentum — a strategy of buying what’s been winning and selling what’s been lagging — is always a powerful force in markets. Globally interest rates, much higher than many expected six months ago, are not helping. Recent economic data indicate an incipient slowdown with inflation still blocking a rate cut, a combination that could make life very tough for the stock market. Instead, stocks have stayed calm, with momentum that draws its undercurrent from the Magnificent humming.
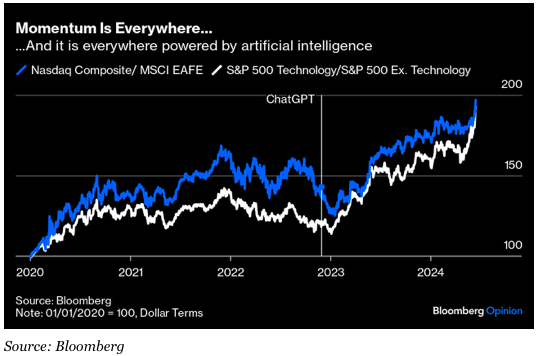
Plainly, the phenomenon is tightly linked to the excitement around artificial intelligence, and shows up in different sectors and geographies. The outperformance by tech stocks compared to the rest of the S&P 500, and by the Nasdaq Composite compared to the MSCI EAFE index of non-US developed markets, has been startlingly similar.
Can this last? The question rings louder with every record the market breaks. Momentum tends to carry on for a long time until something stops it, but it’s very rare for such a rally to persist as long as this one. The one snag with momentum strategies is that when they reverse, they can do so in a very serious way. There hasn’t been a momentum crash for a while.
The biggest momentum reversal this decade came on the day in November 2020 when the results of Covid-19 vaccine tests convinced investors that the worst of the pandemic could be over much earlier than thought. The reshuffle in the stock market was spectacular.
Still, with recession not a base case, equities should have no problem continuing their fine form on the back of the acceleration in earnings growth that started at the end of 2022.
Meanwhile, value investors have been at their wits’ ends. The S&P’s value index has steadily declined relative to the broader index for more than a decade, igniting a debate over whether value is dead.
Value stocks may be down, but don’t count them out yet. When momentum reverses, it does so big time.
“Technically, the best thing that stocks have going for them is momentum. When it reaches the level it’s at, it becomes a powerful force that can continue for weeks or more. There is significant deterioration under the surface of this momentum, so it’s on a shaky foundation and is more likely to fail than if there were more supports. By the time it gets to this stage, we’re usually at the “weeks, not months” part of the cycle. It doesn’t say much about prospects for longer-term investors, but those with a more medium time frame should be on guard. When gains get this easy, it’s usually about to become much less so.”
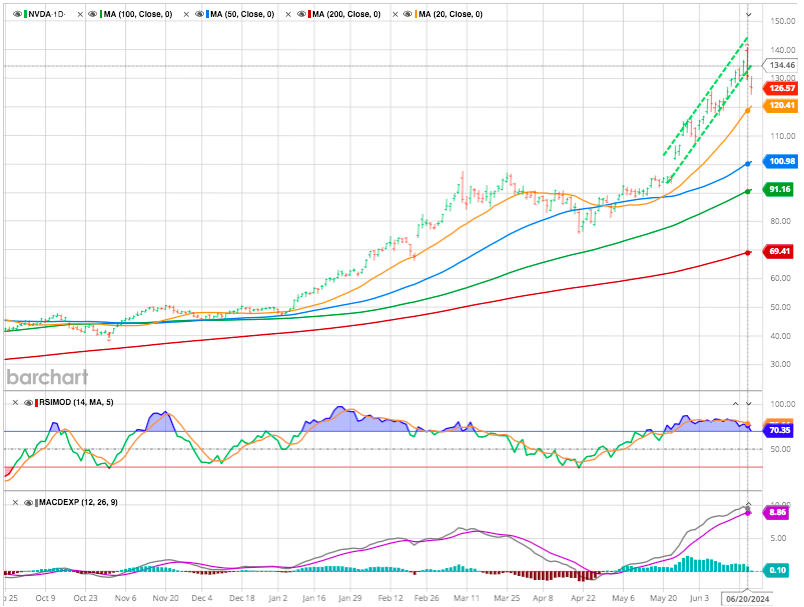
Nvidia Is Hiding The Cracks Beneath The Stock Market Surface !

First negative week for Nvidia since April. Only short consolidation or trend reversal? People seem to be buying the NVDA dip. The stock is putting in some sort of a hammer like candle in the lower part of the “imperfect” trend channel.
Nvidia’s overwhelming influence on the market is masking underlying weakness, potentially leading to a costly mistake.
Indexes with Nvidia are making new highs, while those without are struggling since March peak. Small vs big cap tech gap is very wide. Time for a catch up trade by small caps, or is small cap tech telling us something is “wrong”?
The data since the middle of May shows that Nvidia has wholly overwhelmed the market. The Bloomberg 500, which can be used as a proxy for the S&P 500, has advanced by 2.46% and shows that since May 17, Nvidia has accounted for 81.1% of the gains in the Bloomberg 500 and that 156 stocks have moved up while 345 have moved lower. Apple (AAPL) is the second-biggest gainer, adding 29.9%. This means that the Bloomberg 500 would be lower without Nvidia and Apple. Over that same time, the S&P 500 rose by 2.54%, with 153 stocks advancing and 351 stocks declining.
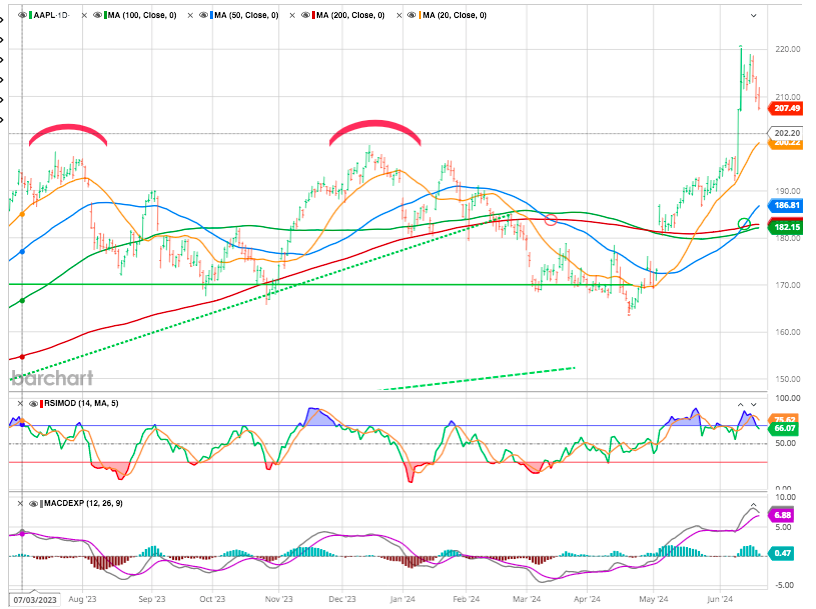
APPLE : Overboughter
Mighty Apple continues pushing higher and RSI stays at extreme levels, but as we all know, overbought can stay overbought for long periods of time.
CRYPTO
In cryptocurrency-land, the breakout higher on Bitcoin has still not happened. Bitcoin is definitely not finding its way back up the bullish path to catch up with its record high reached last March. Bitcoin (BTC) has fallen for the second week running, dropping nearly 9% over the past 14 days.
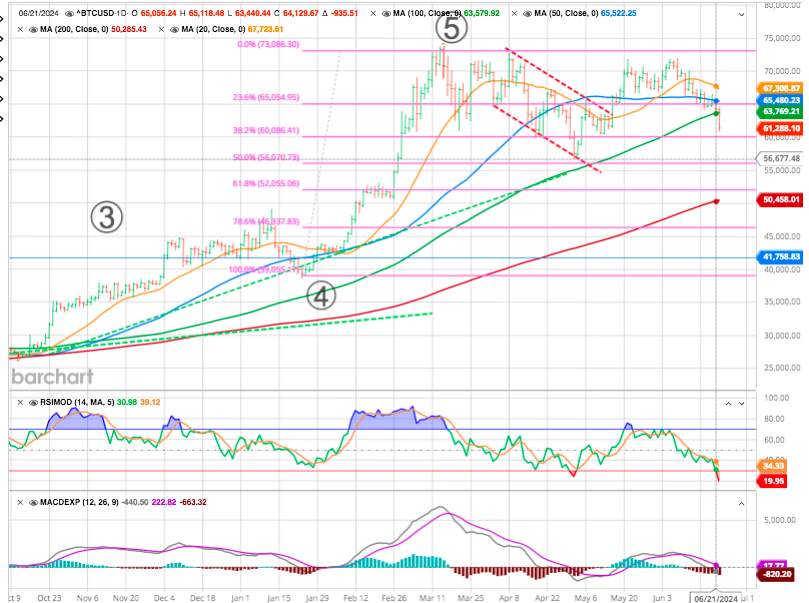
The digital currency is down 3.7% this week, falling back below the $67,000 mark. More generally, the market was down this week, with the total valuation of all cryptocurrencies falling by almost 5% to around $2,350 billion.
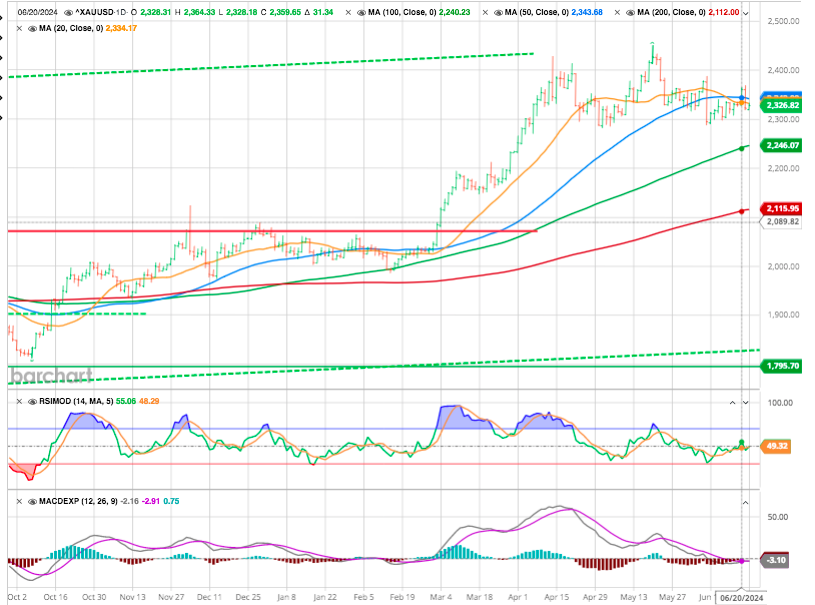
In the commodity space, Gold probably also found a “safe haven” bid. To state the obvious, support at 2,280 looks crucial.
FED Conundrum ?
The Fed now finds itself in a conundrum. It cannot easily revert to a strategy of cutting rates due to the dwindling impetus that had energised the recent rally in risk assets and rates since the November 1 pivot away from raising rates. The factors that fuelled this rally, such as the extension of Money Market fund durations, cannot be replicated given the increasingly two-sided nature of rate risk, and the Fed reverse repo has been exhausted.
Moreover, any attempts to support risk asset markets for electoral purposes by reducing issuance duration could prove problematic, as such a move would need to be fully reversed post-election, potentially during a period of tightening fiscal stance.
Do not forget that an interest rate cut is often linked to a Slowdown/ Recession in the economy and that the Stock Market corrects at this time.
This year it might well collide with the Elections and we can count that the authorities will do whatever it takes (money supply) to avoid any collapse.
If the Fed embarks on a series of rate cuts without the appearance of a recession, then a resurgence of inflation becomes probable.
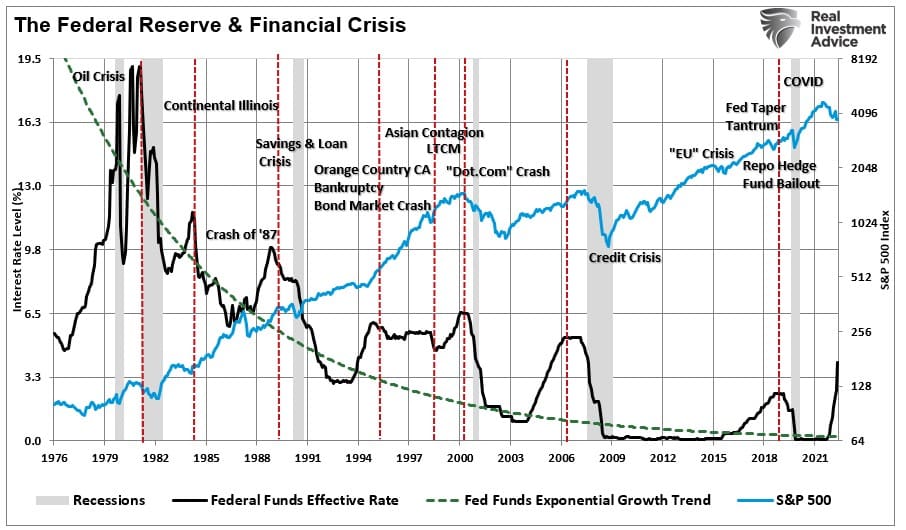
Could the Fed really cut at all time highs?
Of course, with major indices as buoyant as they’ve ever been, some investors may wonder whether the Fed could really cut with stocks at all-time highs? Bulls will be putting their faith in history while bears might argue we’ll only see this magnitude of cuts if something is “broken” – it remains to be seen whether it’ll be the former or the latter…”
Happy trades
BONUS
S&P Equal Weight (weekly)
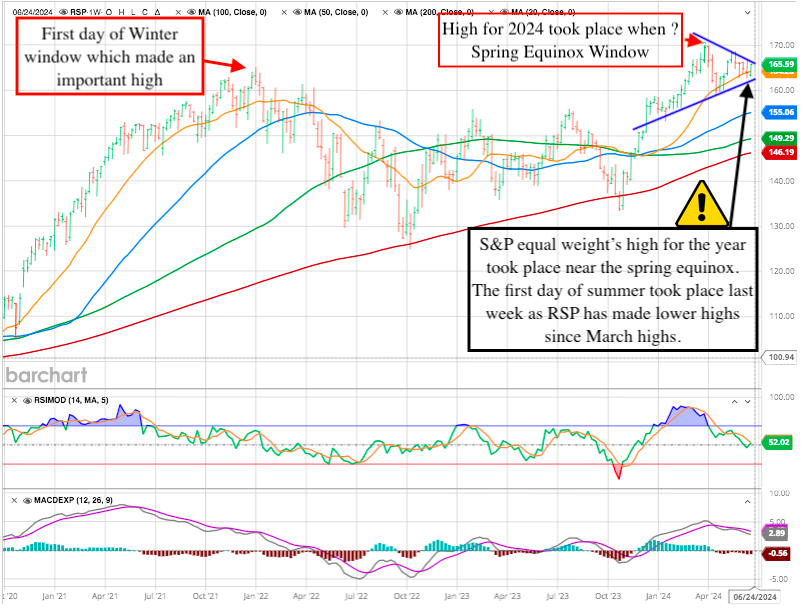
But what will be really interesting to observe here is in which direction the EW-index will break out (and technical analysis suggest that a break should happen soon, as we are already in the last third of the triangle). A break higher would mean a broadening of the rally and continuation of the melt-up into the US elections we have been writing about.