

MARKETSCOPE : Relax and Enjoy
July, 08 2024

President Joe Biden will stay in the race is having little impact on markets. However, macroeconomic data still has an effect, and it’s showing signs of a consistent narrative.
Despite a short week on Wall Street due to the celebration of Independence Day on Thursday, the major US indices continued their record-breaking run. The S&P 500 kicked off the second half of 2024 with its best weekly performance since late April. As measured by Russell 1000 indexes, growth shares outperformed value stocks by 415 basis points over the week, while small & mid caps recorded losses.
Remarkably, the S&P (SP500) is now within striking distance of the 5,600 level and is close to topping the year-end target of several brokerages that have scrambled to keep up with the inexorable bull run as investors bet that any economic weakness later this year will be met with a Fed rate cut.
In Europe, the STOXX Europe 600 Index ended 1% higher. In France, the far right failed to win an outright majority in the 1st round of legislative elections on June 30. Meanwhile, the Labour Party won the UK general election on July 4 with a large majority.
Eyes are also turning to China, which could announce additional measures for its industrial sector this month, according to some players.
The latest US macroeconomic data seem to argue in favor of a forthcoming rate cut by the Fed. Last Friday’s monthly employment report strengthens this scenario recording a slowdown in US job growth, with June job gains falling 12,000 to 206,000, although the drop was smaller than consensus expectations.
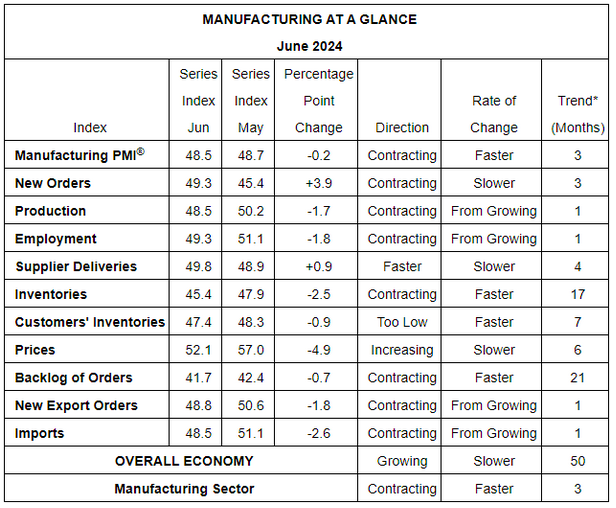
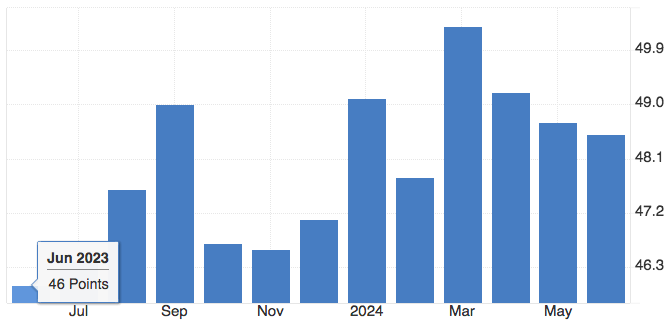
Last Monday, the ISM posted its lowest reading of manufacturing activity (48.5) since February. More surprising may have been a sharp downturn in the ISM’s current services sector activity.
CHECK BONUS : our Allocation Business Cycle System -ABS- proprietary Matrix
After breaking a 16-month streak of contraction by expanding in March, the manufacturing sector has contracted the last three months, and at a faster rate in June.
By June, rate cuts were increasingly in focus, and the ECB delivered their first rate cut since the pandemic, lowering their deposit rate by 25bps to 3.75%. The Bank of Canada also delivered their first rate cut of this cycle, meaning that 4 of the central banks with a G10 currency have now cut rates this year.
Meanwhile in the US, the Fed didn’t cut rates in Q2, but the CPI release for May that was released in June showed the slowest monthly core CPI since August 2021. That helped to cement expectations that rate cuts were still on the horizon from the Federal Reserve, and at the June FOMC meeting, the median dot still pointed to one rate cut by the end of the year.
NEXT
Wall Street will have its hands full next week with the eagerly anticipated June consumer price index (CPI) report and the start of the earnings season.
The economic calendar will be dominated by the CPI report and Federal Reserve chair Jerome Powell’s testimony to Congress. The Fed’s Powell is likely to say policymakers need further confirmation that inflation is slowing before they’re in a position to cut interest rates when he speaks to Congress on Tuesday and Wednesday. His comments will come ahead of Thursday’s consumer price figures for June.
1st Half
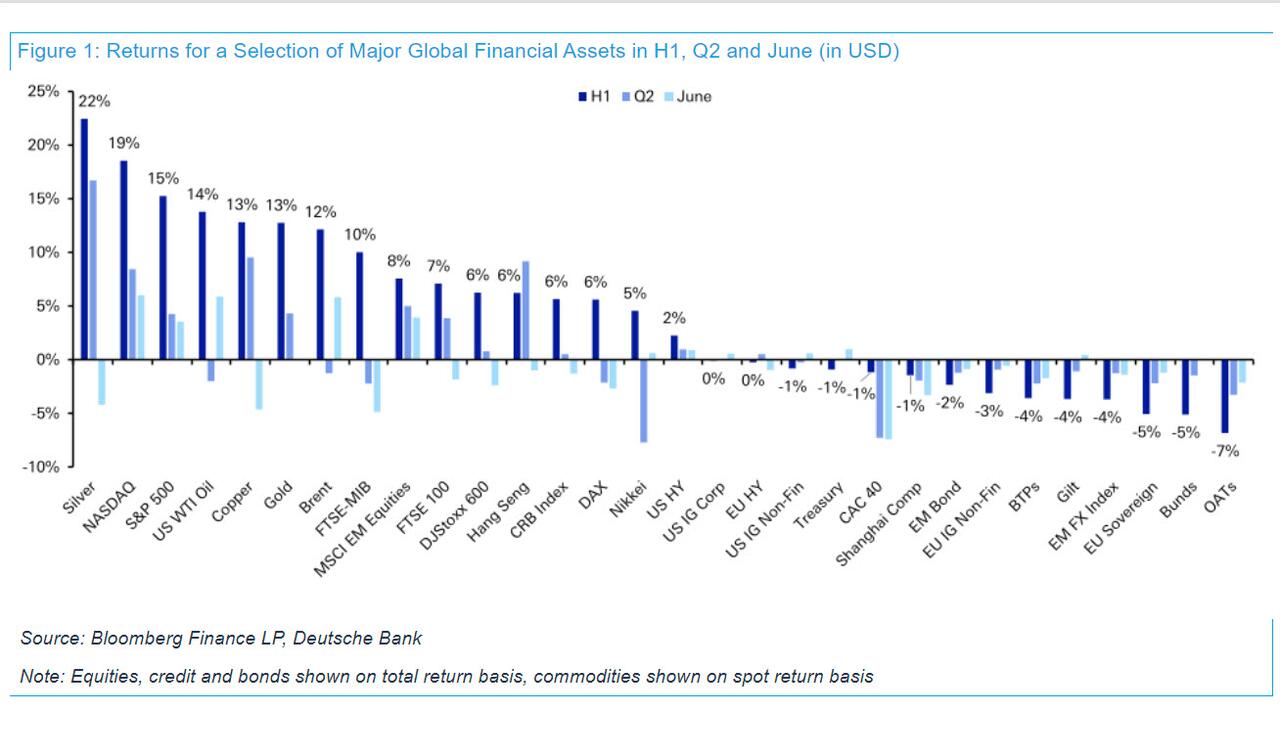
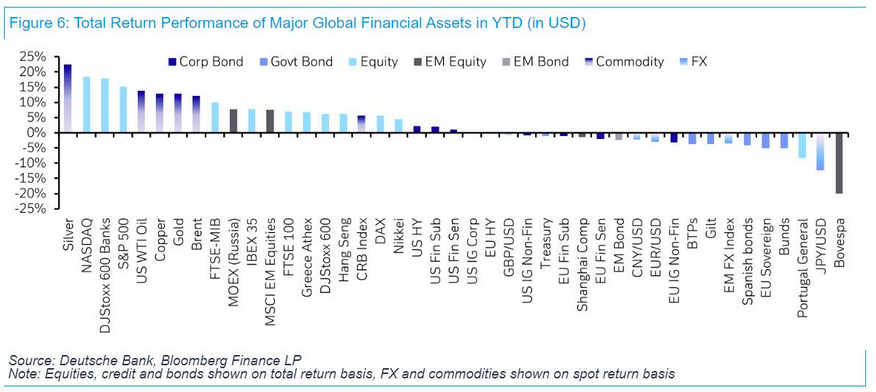
At the start of the second half of the year, Deutsche Bank’s thematic research team published a performance review with this one covering June, Q2, and H1. Let’s take a look at some brief highlights (all USD) and additional comments.
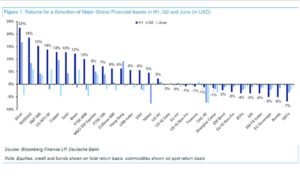
- It may surprise some that silver led the way (+22.5%) in the first half, with other metals like gold (+12.8%) and copper (+12.9%) also high up the list. WTI oil (+13.8%) ensured that hard commodities packed out the top end of the sample in H1.
- The Nasdaq (+18.6% total return) and S&P 500 (+15.3%) had very good H1s powered by a +37.0% advance for the Mag-7 and a stunning +149.5% return for Nvidia. But the small-cap Russell 2000 only returned +1.7% in H1, and was down -3.3% in Q2.
- French assets slumped in Q2 following the snap election announcement.
- As an interesting snippet on global inflation, agricultural commodities are continuing to fall back. Corn (-10.1%) was down for a 6th consecutive quarter in Q2, alongside declines for soybeans (-3.4%) and wheat (-1.2%). So potentially some relief on food prices ahead after a big increase over recent years.
- The weakness in the Japanese Yen showed no sign of letting up, and it’s now been the worst-performing G10 currency in both Q1 and Q2.
Despite the growing move towards rate cuts, sovereign bonds still struggled over Q2 as a whole, in part because investors were pricing in a more gradual cycle of rate cuts. For instance, at the end of Q1, 67bps of cuts were priced in by the Fed’s December meeting. But that was down to 44bps by the end of Q2. So sovereign bonds struggled to get much momentum, and the 10yr Treasury yield was up +20bps over the quarter to 4.40%.
Another theme of the quarter was the ongoing divergence between megacap stocks and the rest. For example, the Magnificent 7 was up by another +16.9% in Q2, which helped the S&P 500 to post a third consecutive quarterly gain of +4.3%.
But there was weakness elsewhere, as the equal-weighted S&P 500 fell by -2.6%, and the small-cap Russell 2000 was down -3.3%.
Meanwhile in Europe, the STOXX 600 was only up +1.6%, and in Japan, the Nikkei was also down -1.9%, after a very strong +21.6% gain in Q1.
Which assets saw the biggest gains in Q2?
The Magnificent 7: It was a very strong quarter for the Magnificent 7, which rose +16.9% in total return terms. Nvidia (+36.7%) advanced for a 7th consecutive quarter.
Metals: It was generally a positive quarter for metals, with silver (+16.7%), platinum (+9.3%) and copper (+9.6%) all having their best performance in 6 quarters. Gold was also up +4.3% in its third consecutive quarterly gain.
Which assets saw the biggest losses in Q2?
French assets: The announcement of a snap election by Emmanuel Macron led to a selloff for French assets. For example, the CAC 40 fell -6.6% in total return terms, while French OATs fell -2.6%.
European sovereign bonds: Even though the ECB cut rates in June, investors moved to price in a more gradual pace of rate cuts over the months ahead, and sovereign bonds lost ground, including German bunds (-0.7%) and Italian BTPs (-1.5%).
Japanese Yen: The Japanese Yen was the worst-performing G10 currency in Q2, which was the second consecutive quarter that’s happened. It weakened by -5.9% to 161 per US Dollar.
Agricultural Commodities: The prices of several agricultural commodities continued to decline in Q2. That included corn (-10.1%), which fell for a 6th consecutive quarter, along with soybeans (-3.4%) and wheat (-1.2%).
MARKETS : Stay Hungry, Stay Foolish
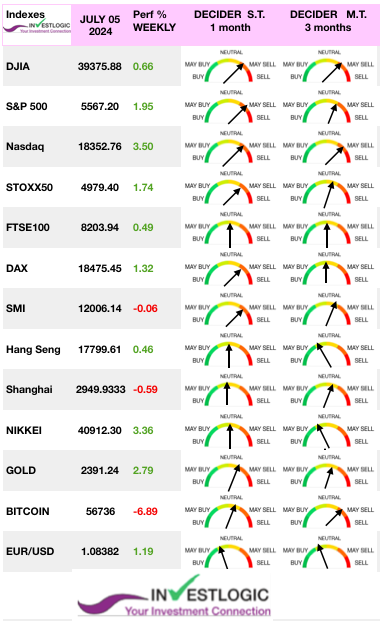
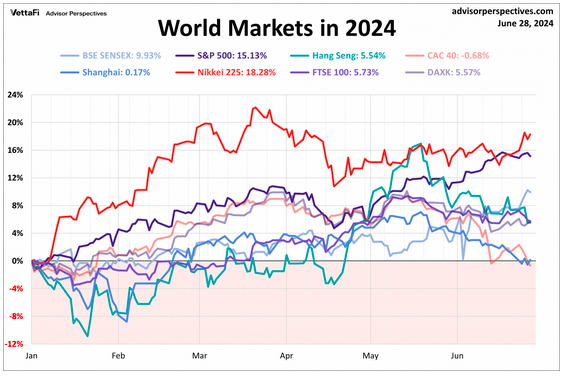
Seven of the eight indexes on our world watch list have posted gains through the first half of 2024. Tokyo’s Nikkei 225 led the way with a year to date gain of 18.28%. The U.S.’s S&P 500 finished in second with a year to date gain of 15.13% while India’s BSE SENSEX finished in third with a year to date gain of 9.93%. France’s CAC 40 is the sole loser for the first half of the year, currently down 0.68% year to date.
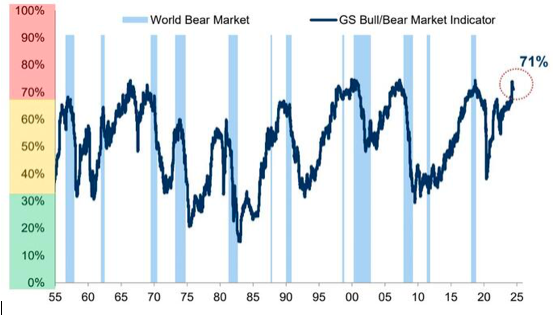
Goldman’s ‘Bull/Bear’ Indicator Is “Flashing Red”
The end of the first half of the year marks the end of a very powerful rally in risk assets that started in October last year that has taken global equities roughly 30% higher. The first half of 2024 has been the 21st best since 1900 for the US market. An interesting chart from Goldman Sachs
The market remains overbought short-term, but the recent rally is close to flipping the short-term MACD “sell signal.” Such would suggest that while the overbought condition could limit the upside, the market will likely try to climb higher over the coming weeks.
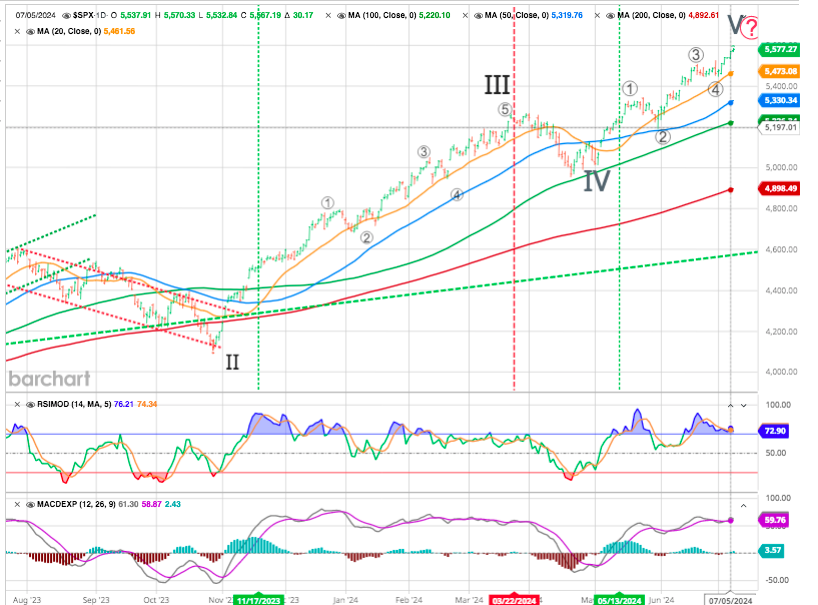
The market continues its bullish trend from the October 2023 lows. Of course, that rally has been the byproduct of the chase for anything related to “artificial intelligence,” the chase for performance (buy the “Magnificent 7”), and ongoing hopes for Fed rate cuts.
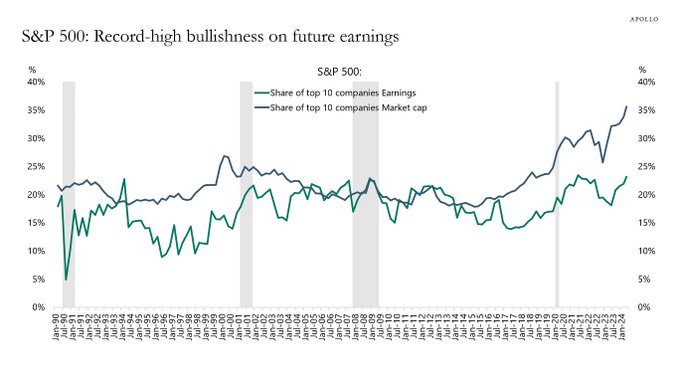
The top 10 companies in the S&P 500 make up 35% of the market cap but only 23% of earnings. This divergence has never been bigger, suggesting that the market is record bullish on future earnings for the top 10 companies in the index.
In other words, the problem for the S&P 500 today is not only the high concentration but also the record- high bullishness on future earnings from a small group of companies.
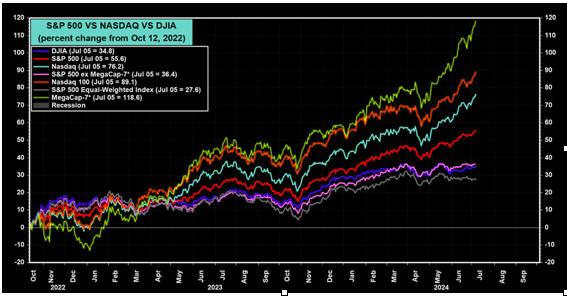
Of course, a broadening of the bull market from the S&P 500’s MegaCap-7 (i.e., Alphabet, Amazon, Apple, Meta, Microsoft, Nvidia, and Tesla) to the rest of the index, i.e., the S&P 493 is desirable. The former is up 118.6% since the start of the bull market, while the latter is up 36.4%.
Source: Yardeni Research
That’s still a bull market excluding the MegaCap-7. In other words, part of the breadth problem is that the prices of seven stocks have increased much faster than those of the rest of the S&P 500. Is that really a breadth problem?
However the top 10 companies in the S&P 500 make up 35% of the market cap but only 23% of earnings. This divergence has never been bigger, suggesting that the market is record bullish on future earnings for the top 10 companies in the index.
While the Magnificents’ earnings expectations have been surging higher since the beginning of last year, mainly driven by the enthusiasm over artificial intelligence, collective expectations for the other 493 have been falling steadily.
In the US, year-on-year earnings growth is on course to hit 12.1%, while global earnings growth is at 6.6%.
That said, the profits made by the non-Magnificents remain more than 15% below what was expected two years ago, while the Seven’s profits are coming in 20% above their level from then.
In other words, the problem for the S&P 500 today is not only the high concentration but also the record- high bullishness on future earnings from a small group of companies.
The chart below shows our most reliable gauge of market valuations, based on correlation with actual subsequent S&P 500 total returns in market cycles across history. The chart shows the ratio of nonfinancial market capitalization to gross value-added, including estimated foreign revenues. The present level exceeds both the 1929 and 2000 extremes, and is higher than every point in history except 5 weeks surrounding the January 2022 market peak.
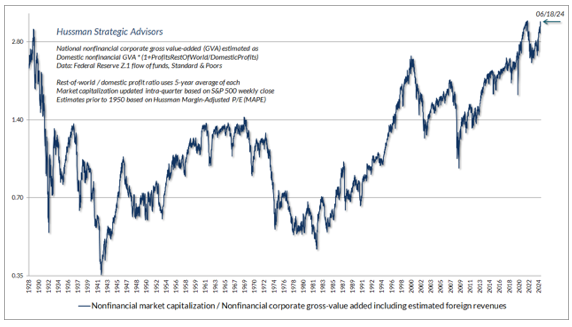
Source https://hussmanfunds.com/comment/mc240623/
Of course, extreme valuations alone don’t necessarily imply near-term market losses. If overvaluation was enough to drive the market lower, it would be impossible to reach valuations like 1929, 2000, 2022, and today. The only way the market can get to levels like today is by blowing through lesser valuation extremes without consequence.
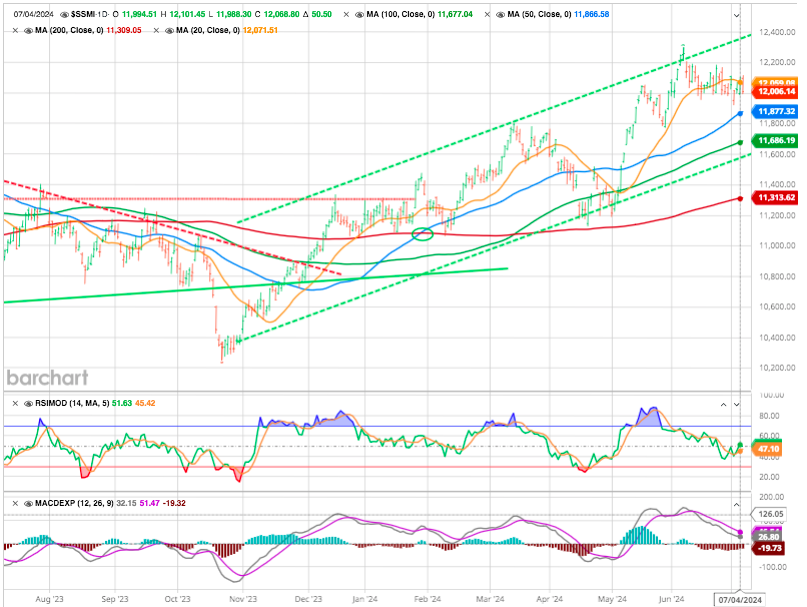
SMI : Consolidation
CRYPTOS : Bitcoin’s range mania
Bitcoin is the king of mean reversion trading. You buy range lows, and sell range highs…. We pointed out the set up in late June (here) was not convincing. Note the big trend line comes in right at range lows, and the 200 day is slightly lower.
Bitcoin has been falling sharply since last week. The digital currency has tumbled by more than 11% this week, and is now trading around $55,500. The main reason, as with last week’s drop, is the start of reimbursements to customers harmed by the hacking of cryptocurrency platform Mt. Gox in 2014. Over 140,000 bitcoins have been recovered from a total hack of 940,000 BTC.
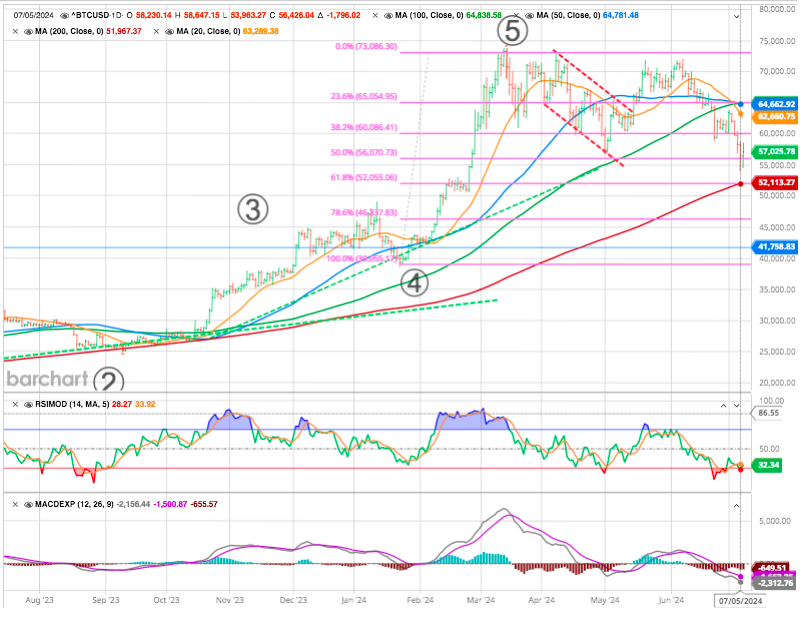
Bitcoin entered bear market territory. Bitcoin’s big support at 60k and the longer term trend line are gone. We are well below the 100 day moving average and we have not traded this much below the 200 day moving average in “forever” (Fibo 61.8 % retracement of the last wave up). Assets tend to move violently when big ranges are broken as the psychology inside the consolidations create a form of vacuum, above/below key resistance/supports. BTC is down around 25% since early June.
Happy trades and Happy Summer time

We’re wishing everyone much success during the second half of 2024.
Until next time.
BONUS
The move in the ISM report indicates that S&P 500 earnings growth could turn lower by 2025 and perhaps go negative. The relationship between the ISM manufacturing survey goes back a long time, and they, too, tend to track each other very well.
Thus, hard to appreciate why right now would be different with the economy on the verge of recession.
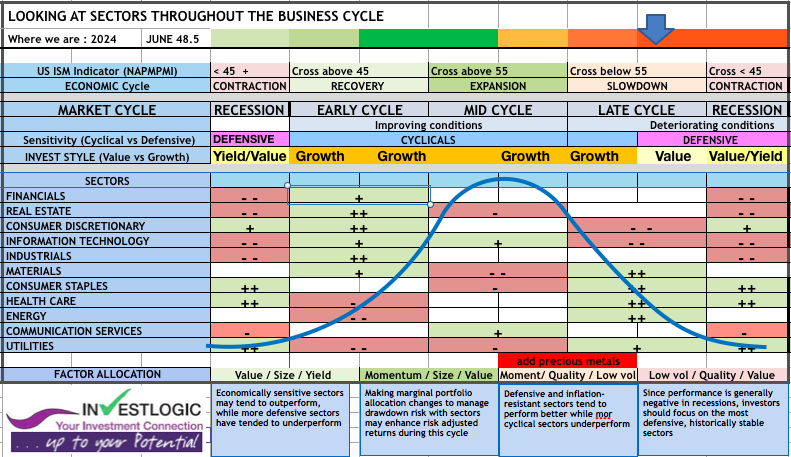
Note: The typical business cycle shown above is a hypothetical illustration. There is not always a chronological progression in this order, and in past cycles the economy has skipped a phase or retraced an earlier one.
Unshaded (white) portions above suggest no clear pattern of over- or underperformance vs. broader market. Double +/– signs indicate that the sector is showing a consistent signal across all three metrics: full-phase average performance, median monthly difference, and cycle hit rate. A single +/– indicates a mixed or less consistent signal. Returns data from 1962 to 2016. sectors are defined by the Global Industry Classification Standard (GICS®).
Source for sector performance during business cycle: Fidelity Investments (AART). Past performance is no guarantee of future results.
SEE our ABS presentation and Business Cycle & Sector Rotation also check previous comments