

MARKETSCOPE : Staying Alive
July, 01 2024

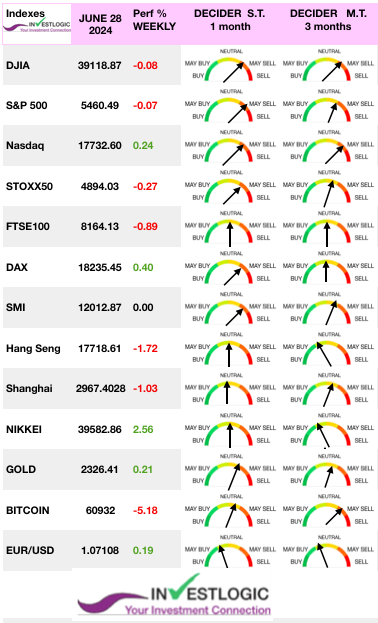
Most major U.S. indexes remained unchanged in a light news week during what seemed to be a bit of a lull in market activity. The bigger story was the benchmark index closing out the first six months of 2024 with a whopping 14.5 % advance.
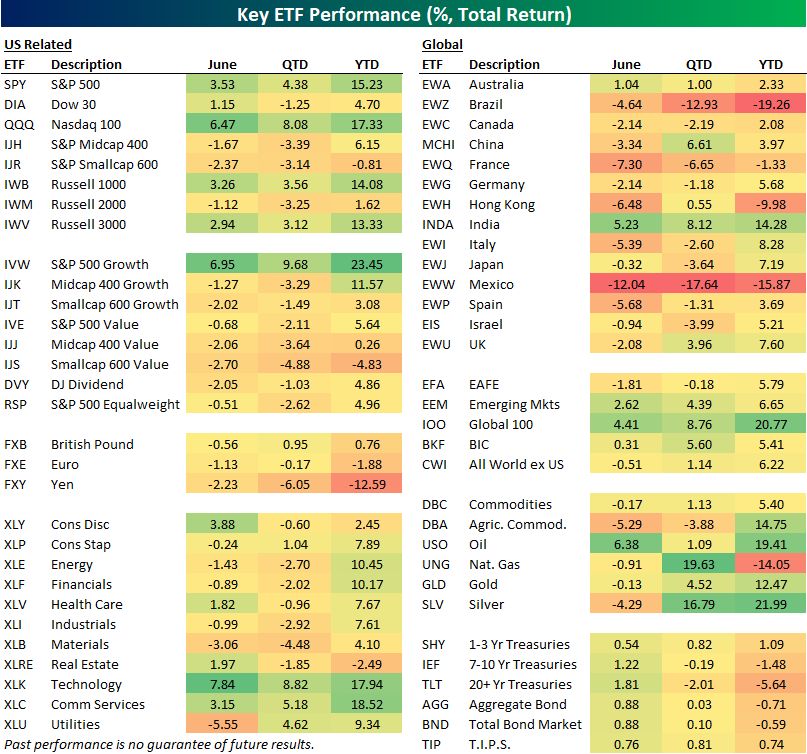
Small-caps and Tech stocks performed best, with growth style outperforming value. The banking sector performed well as media reports said that the FED is considering significantly lighter additional capital requirements for banks than regulators originally proposed in the wake of the regional banking crisis in March 2023.
The main macro number of the week was Core PCE which showed that prices excluding food and energy rose 0.1% from April. Note that “Supercore” PCE rose by 0.1% in May, its smallest monthly increase since August 2023. This could report could prompt a possible rate cut by the Federal Reserve as early as September.
The Fed Funds Rate is now 2.7% above Core PCE, the most restrictive monetary policy we’ve seen since September 2007.
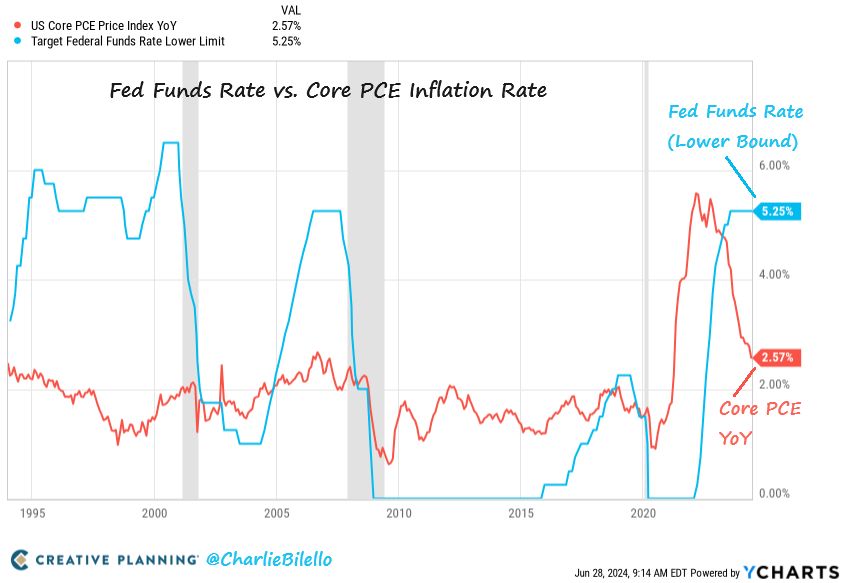
Source: Charlie Bilello
The stellar H1 performance that saw the S&P 500 go on a record-breaking spree was largely driven by a blistering rally in technology stocks over the artificial intelligence craze and progress towards a scenario where the Federal Reserve can finally begin to cut interest rates. However, this week’s slight decline in the index shows how recent concerns about market breadth and the outsized dominance of megacap technology stocks have weighed on investors.
Source Bespoke
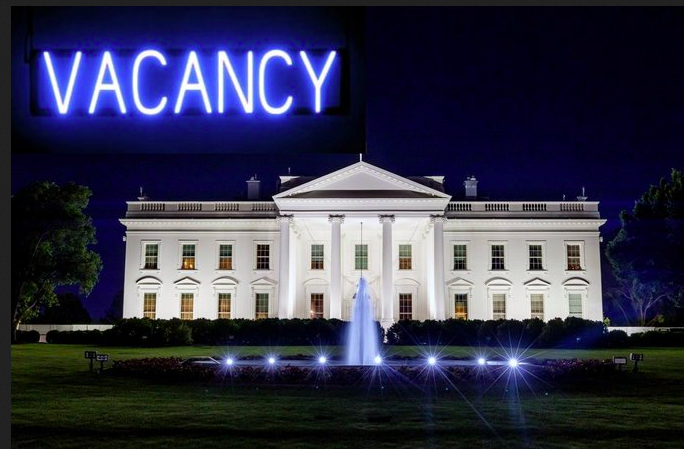
US 2s/10s spread jumps by 7bps to -36bps sharply after US presidential debate.
 European markets displayed nervousness this week amidst political and economic uncertainties. STOXX Europe 600 Index ended 0.72% lower amid heightened political uncertainty in France with the snap election called by President Macron. Eurozone government bond yields rose ahead of inflation prints in the eurozone.
Japan’s stock markets rose over the week, with the Nikkei 225 Index gaining 2.6% and the broader TOPIX Index up 3.1%, as historic weakness in the yen continued to support the country’s export-heavy industries. Chinese stocks weakened as a light economic calendar and concerns about the slowing economy curbed risk appetite.
NEXT
Wall Street will see a holiday-shortened week due to Independence Day falling on July 4. But investors will still have plenty to look forward to.
This week we shall have the release of the CPI and unemployment rate in Europe on Monday, followed by services and composite PMI data from most regions.
The US economic calendar will be dominated by data on the labor market, with Friday’s closely watched nonfarm payrolls report for June.
Markets : EVERYTHING IS “NORMAL “
If, as Warren Buffett famously teaches, “The price you pay determines your rate of return,” then investors could be greatly disappointed in the years to come given today’s extreme equity valuations.
The market remains overbought short-term and has triggered a short-term MACD “sell signal,” which could limit the upside in the near term. The NYSE Advance-Decline line and the Relative Strength Index (RSI) have reversed, adding to the negative divergences from a rising market. While this does not mean the market is about to crash, it does suggest that the current rally is weaker than the index suggests.
These negative divergences have often preceded short- to intermediate-term corrective market actions. Could this time be different? Sure. The entire bet of the market remains mired in the Fed cutting rates. That narrative is still alive and well, at least on the surface. However, like walking across an ice pond, while you can hear the ice cracking beneath your feet, one is never sure exactly when it will give way.
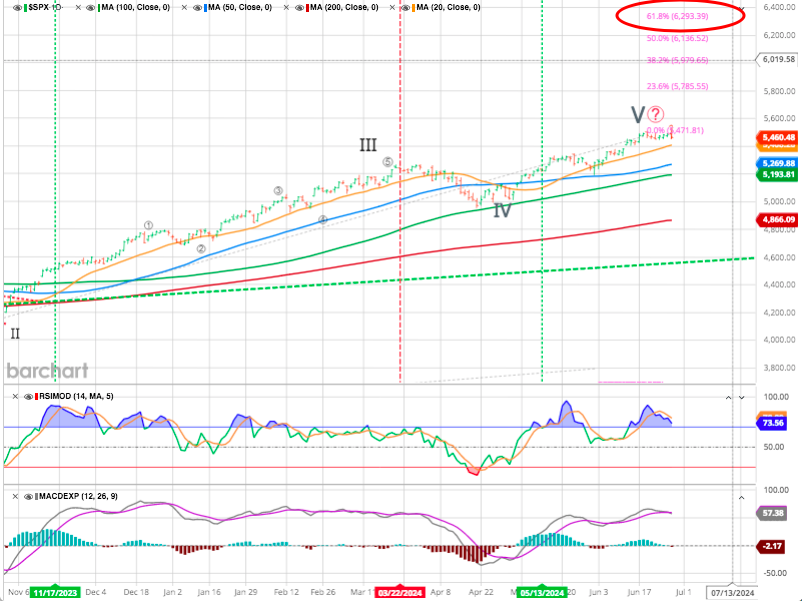
Goldman Sachs recently upped its price target to S&P 6300 for the end of this year, along with Evercore ISI upping its year-end target to 6000. Such is not surprising given the strong run in the markets this year.
How did we pick S&P 6300? We used a standard Fibonacci sequence to identify the logical, numerical sequence from the November 2023 lows. From those lows, an extension of 1.62% would take the market to roughly 6300 (6290, to be exact). However, for the market to make that advance, the underlying earnings will need to support the continued rise.
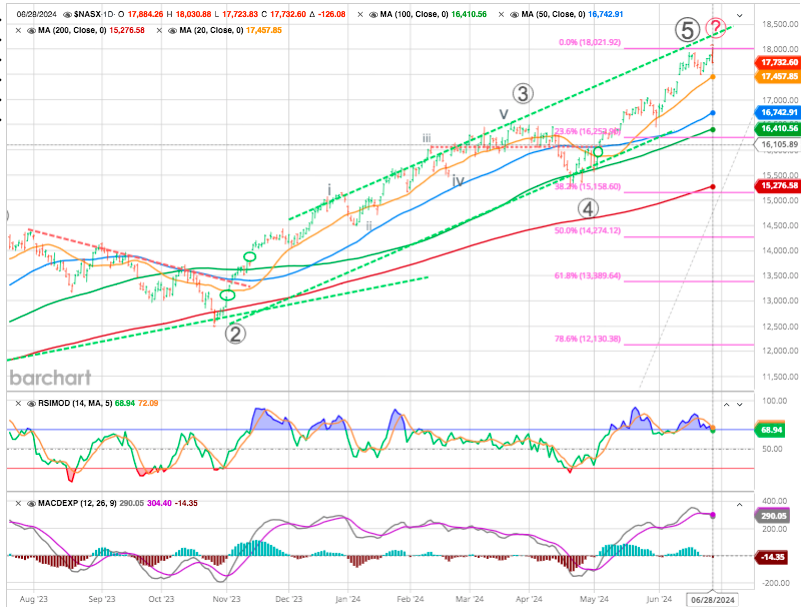
NASDAQ managed staying in the upper part of the big trend channel. We are slightly less overbought, but note the 50 day is way lower. 18k is a short term level to watch. A close below it and the next big support is down around the 16700 area (lower uptrend chanel).
On the other hand, the BofA Bull & Bear Indicator is at 6.2 signal is Neutral. A key point that we are neither close to “too hot” nor close to “too cold” regime.
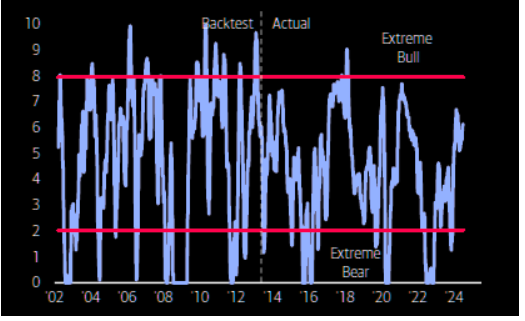
Source BofA
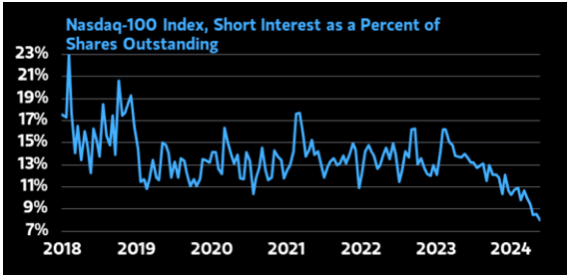
Tech shorts are in hibernation as NDX only goes up…
As noted previously article, valuation contractions happen during recessionary and bear market periods. During such a phase, the exuberance of the market realigns the price of the market with the underlying fundamentals. However, multiple expansions are underway before the beginning of the reversion process. During this bullish phase, Wall Street analysts continue to ratchet earnings estimates higher to justify rising prices.
The risk to investors is that stocks will again begin to move in the same direction, all at once. When that happens, some fear, the role of complex volatility trades could reverse and, rather than dampen the appearance of turbulence, exacerbate it.
Currently, we are in the multiple expansion phase, where analysts are dramatically increasing earnings estimates to more extreme levels.
Earnings and AI
Never the less Corporate profitability appears to be fine, and there’s little fear among asset allocators that profits will come down in the next year.
What’s strange is that this seems almost divorced from the economic cycle, where views are more diverse. It also flies in the face of profit margins’ long-established historical tendency to revert to the mean. That’s chiefly because of artificial intelligence.
In other words, the bet is on that AI has raised the profit share, or the proportion of revenues that companies can keep as profit, a number that tends to mean-revert, and has underwritten a continuing secular rise in earnings growth. That’s a big assumption.
For the time being, tech companies are taking an ever greater share of the market and their earnings look impregnable, perhaps because they’re operating in oligopolistic conditions.
Source :SergeiAI
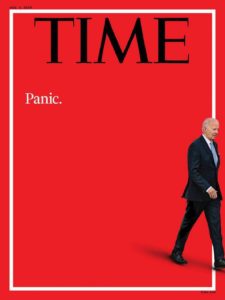
The biggest risks to look out for, then, are an emphatic rise in inflation, or a major reverse for AI. Both would set the cat among the pigeons. As for politics, asset allocators aren’t so bothered. So economically consequential political surprises could indeed matter a lot (see the extraordinary presidential debate in the US and its market aftermath).
THE BEAUTY AND THE BEAST
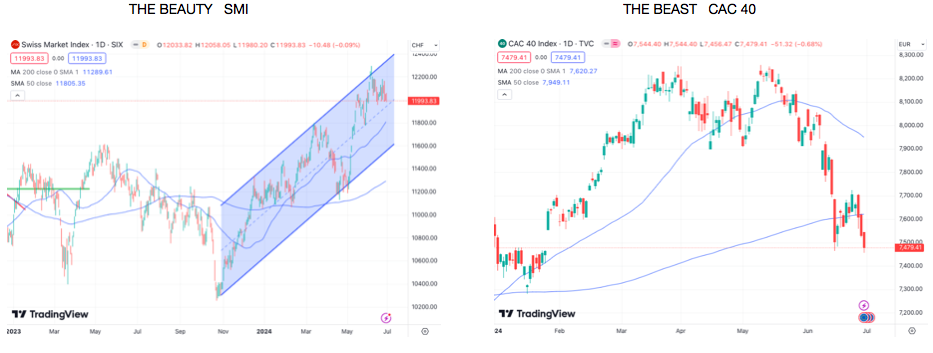
The CAC 40 is close to the most recent “panic” low close…and the gap vs SX5E ans SMI is huge.
King Dollar Drives Yen to 38-year Low
The Japanese yen’s dramatic decline underscores the powerful influence of the Federal Reserve on global markets. Japanese authorities find their intervention efforts ineffective as the yen touched a 38-year low (1986) against the dollar.
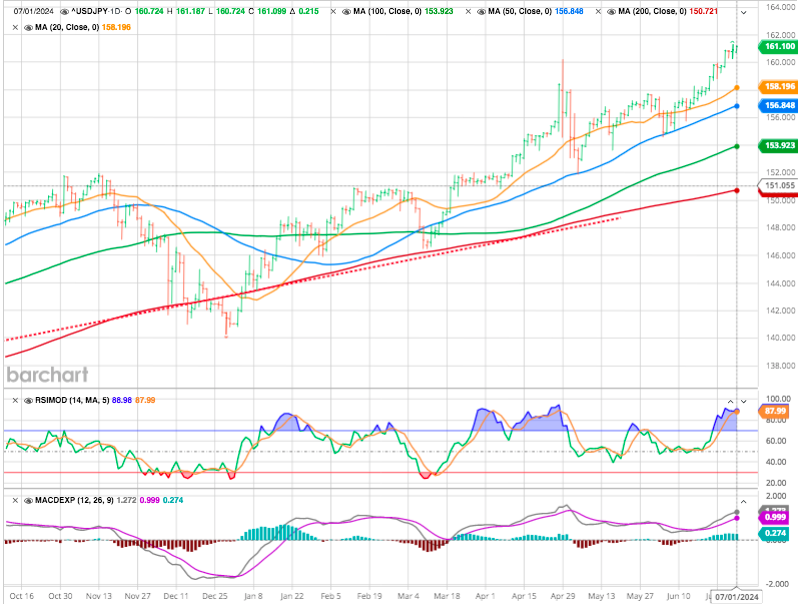
Despite Tokyo’s interventions, the yen’s decline illustrates Japan’s limited control over its currency amid US monetary dominance. Investors and analysts point to the need for the Fed to ease its policies to alleviate the yen’s slide. The current scenario exemplifies how global financial markets are deeply interconnected, with US policy decisions exerting widespread influence.
Happy trades