

MARKETSCOPE : Fear Is Good
October, 17 2022
WHAT A RIDE !
“The term rollercoaster is one of the most overused, lazy terms to describe markets, but the last week closing days are best summed up by being a major rollercoaster ride and actually home to one of the biggest intra-day turnarounds in living memory.” Deutsche Bank’s Jim Reid.
Last week stocks went on a roller-coaster rise with the major averages seeing a historical, but epic turnaround. US CPI inflation data showed that core consumer prices rose 6.6% on a y/y basis in September.
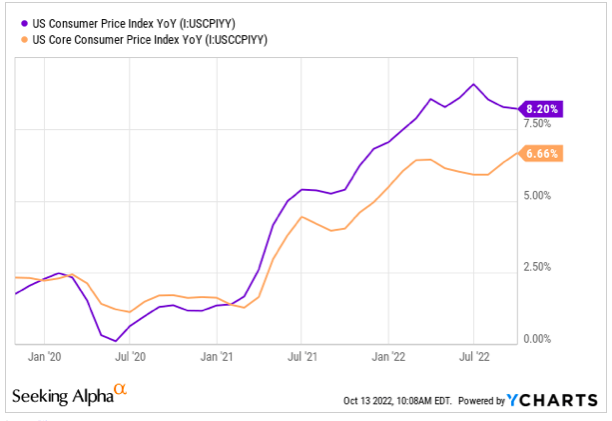
The above chart suggests that the Fed has a lot of work to do before inflation is back at the desired level: CPI has taken hold at the 8%-plus level and remained there for quite some time, while core CPI is still rising, potentially breaching 7% in the foreseeable future.
Fed Pivot Becomes Even Less Likely.
It appears that the case for a fourth consecutive 75-basis point hike in September is pretty much sealed, although there are now talks that the Fed could even hike by 100 bps.
 This was more than expected, above the previous March peak, and the fastest pace in four decades. That had all the hallmarks of a huge selloff, but the broader market bounced back more than five percentage points on an intraday level. Shares surged and bulls looked to be back in control. According to Bloomberg data going back to 1990. It was just the 11th time since 1993 where SPY made a 52-week low and closed more than 4% above that low while also closing green.
But inflation reared its head again at the last trading day and the University of Michigan’s survey showed inflation expectations one year out rising for the first time since March. When the dust settled, the S&P (SP500) closed down 1.6% and earnings are now likely to drive market direction going forward.
There shouldn’t be any confusion; the rally on Thursday was not in celebration of the CPI report, nor was it a capitulator event. It was a big short-covering event that turned into an option-fueled squeeze.
Health care and consumer staples sectors outperformed, while consumer discretionary and communication services shares lagged. Value stocks outperformed their growth counterparts.
Shares in Europe were little changed after suffering a sharp pullback in the week prior.
While waiting for the ECB’s decisions at the end of the month and the Federal Reserve’s decision on November 2, attention next week should turn to corporate earnings releases. The leading US banks, which published their results this week, have just announced a drop in their third quarter earnings per share. Financial markets are definitely not boring, they rival the best Netflix series.
MARKETS : A Blip or a Bottom?
The question remains whether this historic reversal signals a base where bulls can gain further traction.
Many proclaiming that ‘THE’ bottom is in likely have said that many times this year already. From a seasonality standpoint, a (temporary) low today fits the narrative.
Friday action definitely gives the bulls some ammo they have been lacking much of this year.At the very least, this could give some near-term relief. With that said, it’s far from an all-clear signal and we aren’t yet ready to proclaim that the worst is behind us.
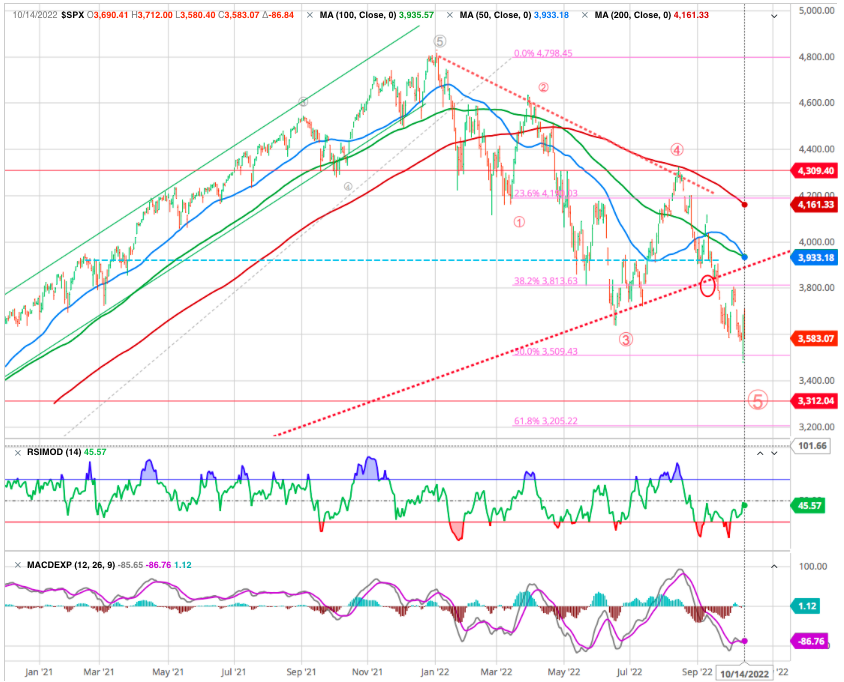
Notably, the widespread opinion is that the market continues to flirt with support at the 200-week moving average, which has defined the “bullish trend” since the financial crisis lows. In other words, despite the “correction” from this year’s highs, the ongoing bull market remains intact. However, a “confirmed break,” which will be a close, retest, and failure of that bullish trend, will constitute a bear market.
As our readers know we prefer to use the 156 weeks MA reflecting the 5 years business cycle and this MA has been broken several weeks ago now at 3811 level (vs 35o2 for 200MA) , hence our negative stance for some times.
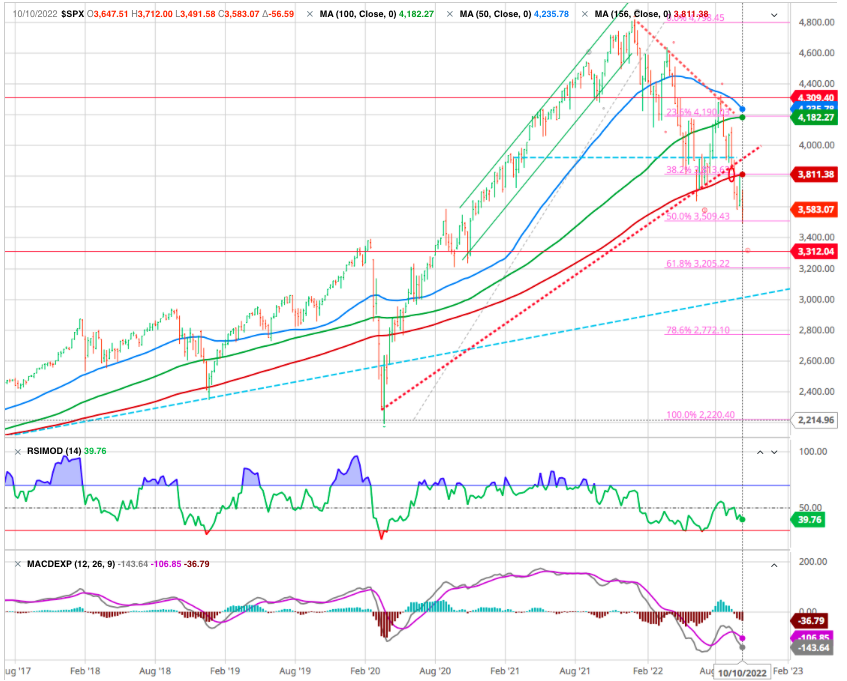
The index hit the 50% Fibo retracement before bouncing back.Considering the general environment (See EARNINGS below) we are maintaining our target to a 61.8 % correction at 3200.
Especially since the Nasdaq already broke its weekly 200MA and tested the 61.8% retracement level.
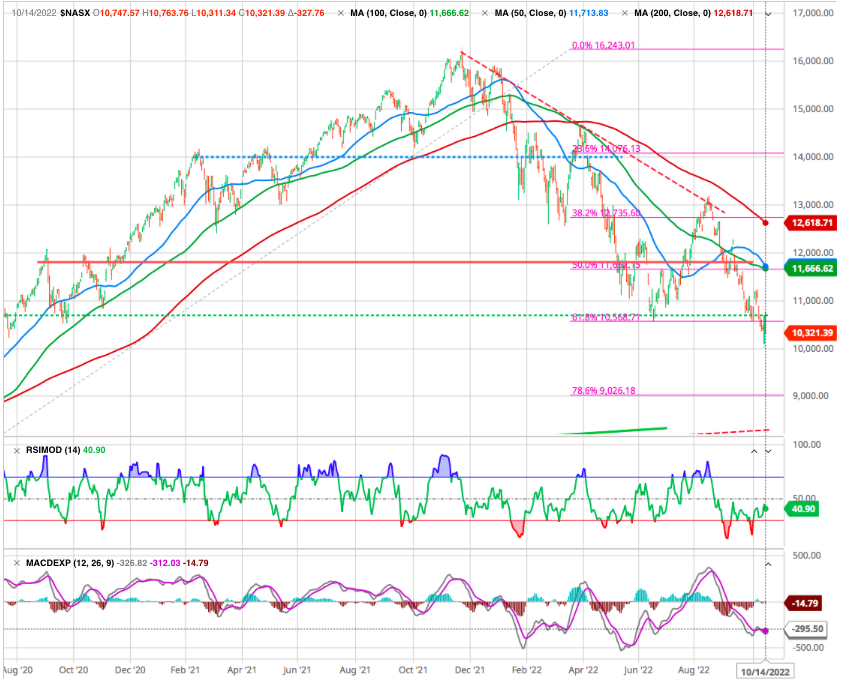
if the bulls want to push the market higher and create a significant low here, they must clear the above resistance zone on today’s daily close. For confirmation, we need to see a higher high above 11730, the most recent high that preceded the latest drop.
That said, the longer-term trend is bearish, and we continue to expect the markets will struggle until something changes fundamentally. Despite yesterday’s sharp recovery, the bears are still in charge of the overall price action. But they must now wait for some form of confirmation to suggest the squeeze is over. Perhaps, it may be best to zoom in on the lower time frames and look for signs to tell Thursday’s sharp rebound was merely another bull trap.
Ultimately, we are pointing to a 9000 level which is also the primary long term trend boundary and 78.6% correction !
In all previous “bear markets,” the bullish trend failed, and the 50-week moving average crossed below the 200-week.
Yes, those things may come, and if they do, we will see the bullish trend broken, and the Fed might reverse course.
There will be a day when a bullish narrative takes hold and the market makes its bear market low.B ut with the market oversold on a short-term basis, and longer-term deviations more extreme, we continue to look for a reflexive rally. Use any rally to raise cash levels and reduce equity risk accordingly.
SOXX : Leadership test
An other largely followed indicator is the Semiconductor sector which presumably is an advanced indicator.
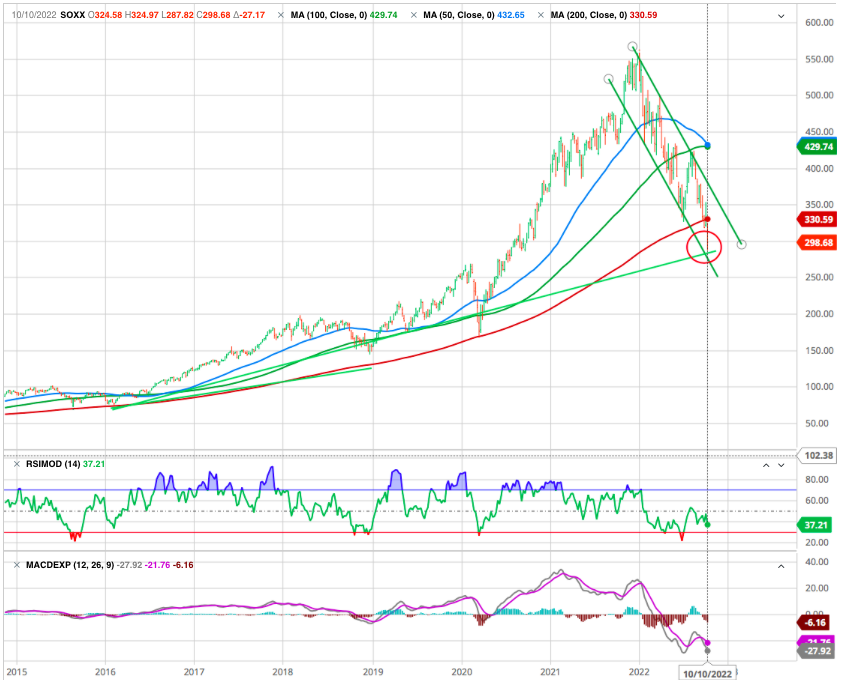
We can see the ETF is just on its support (green line) and the lower bound of its downtrend channel. If support fails to hold (red circle) look out below for the group and the market.
SMI (LT): Still close to 61.8% Fibonacci retracement level support
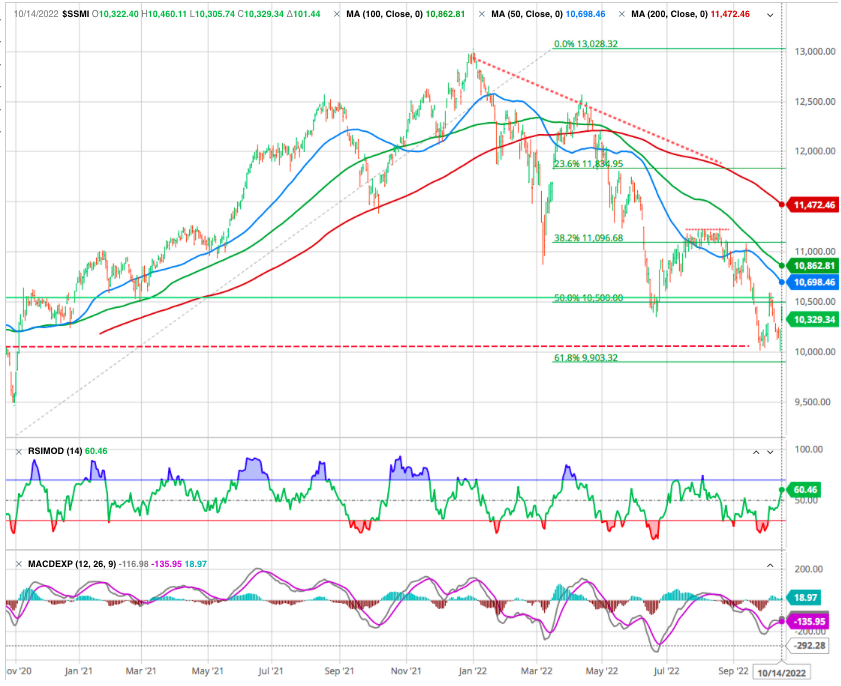
While the Swiss index seemed to be holding up relatively well in the downturn due to its rather defensive profile, the recent price action has been negative and the index has fallen below key technical support at 10,317. The next supports are at 10k.
ST, the index tested the lower band of the downtrend channel while the stochastic indicator reached an extreme oversold level. A relief rally occurred, but the LT trend remains bearish.
EARNINGS : Consensus Estimates Need To Be Discounted Significantly
There is a reasonable probability the trend line will break before this cycle completes. The reason is that while we are certainly due for a robust counter-trend rally, the market has likely not accounted for an earnings recession in 2023 as a global recession takes hold.
Although earnings estimates have come down and forward P/E ratios have dropped markedly, there is still a problem with an earnings recession and why the bullish trend is at risk. As mentioned in our last week report the high correlation between the ISM Manufacturing Index and corporate earnings suggests earnings growth rates will decline further.
Perhaps more essentially at this moment is what happens on the earnings front as we roll into Q3 reporting season. Even more important than the Q3 results is what they say about estimates for the future.
Using the early 3Q 2022 reporters, companies reporting quarters ending in August, as a gauge on how overall earnings season will shape up when the majority report with quarters ending in September report this month.
Twenty S&P 500 companies have now reported their August quarter ends :
- Their next quarter (i.e. 4Q 2022) EPS estimate changes are the worst which have been measured since the economy was being shut down for Covid in 2020.
- Steep cuts at CarMax, Carnival FedEx, Micron and Nike are the primary culprits for the negative revisions.
- We anticipate more negative revisions ahead based on these early reporters.
- Foreward P/E assumptions are problematic as they do not account for future changes. Those changes are coming, and they will likely be considerably larger than most investors expect, particularly if something “breaks” economically.
- Importantly, valuations will likely revert past the exponential growth trend before completion. Such will be a combination of declining prices to adjust for declining earnings.
- Stay underweight stocks until we can determine when the worst of the cuts are over. There is a chance this earnings season will be the worst of the cuts. If so, the bottom in stocks will likely occur plus or minus three months from that point.
Last but not least :
- Move “stop-loss” levels up to recent lows for each position. Managing a portfolio without “stop-losses” is like driving with your eyes closed.
- Be prepared to sell into the rally and reduce overall portfolio risk. As the rally ensues, you will start to second-guess selling. Avoid that emotional trap and follow through with your plan.
If an earnings recession occurs, falling prices and earnings will jeopardize the long-term primary bullish trend.
Applying a -25% earnings surprise revision to the current consensus estimates to account for a deeper recession, investors must be prepared for more substantial value compression if the market anticipates a worse global recession.
Assuming that 17x trailing CAPE valuations is realistic, and an earnings recession leads to $170-180 / share in earnings, then a price target of 3000-3100 is reasonable. From peak to trough, such would be a drawdown of roughly 36.5%, which is well within the context of a break of the bullish trend and a bear market. However, a 15x valuation at $180 / share is 2700, or a decline of 44%.
The first busy week of the earnings season will feature big reports across sectors with Bank of America (BAC), Johnson & Johnson (JNJ), Netflix (NFLX) and Procter & Gamble (PG) all due to step into the earnings confessional.
So, while investors continue hoping for the best, they need to be prepared for worse outcomes. No one can accurately predict the market with absolute precision all the time (a timely reminder that past performance is also not indicative of future predictive potency).
As such, we urge or subscribers/clients to layer in over time appropriately. Also, don’t use leverage; allocate capital wisely, avoiding unnecessary concentration risks.
GOLD
Relative to most asset classes, gold continues to outperform in a broad-based bear market. Since Q2 2020, gold has held above $1,700 but in mid-September, a significant risk-off wave occurred, breaking nearly every risk asset lower. The primary causes were higher than expected inflation data forcing yields (especially real yields) and the USD higher, two important gold drivers. With $1,700 support broken, the next level of support is about $1,550, the approximate pre-COVID trade level.
FED Minutes
The Fed can use the minutes to bury a landmine that will explode three weeks later. The great 2022 downturn in bond yields began after the minutes from the December meeting revealed that the Fed was thinking of abandoning its bond purchases, and considering a move to selling bonds instead.

There was no great pivot concealed in the September minutes, however. Instead, they emphasized that the Fed’s governors fear that underreacting to inflation could cause more pain than overreacting. The takeaways are handily summarized here;we really failed to find anything that ran counter to what we learned immediately after the meeting three weeks ago.
To complete the hawkish commentary, Janet Yellen, gave a speech in Washington in which she said that inflation was the US priority. It was a balanced speech, but there was no hint of any approaching U-turn.
In general, the bear market bottoms as rates are plummeting lower. This is often what is called the TINA stock market environment where “There Is No Alternative” to owning stocks in the Fed induced low rate landscape.
Specifically, should we take the Fed’s projections for the economy and its own rate hikes at face value, we could go from a deeply negative real Fed funds rate to a positive one. Positive real rates were the norm until the Great Financial Crisis, and yet many investors believe we can settle back into the “norm” of the past decade.
Now let’s consider the current circumstances. Is the Fed lowering rates at this time as we sink into a bear market?
No, actually the Fed is raising rates at the most dramatic pace in history to help tame rampant inflation. In fact, the Fed is trying to CAUSE a recession to help lower demand which leads to lower prices.
So as the recession unfolds, and as the stock market sinks lower, rates will not be low this time around. As you know they will be very high at this juncture and then the Fed will finally get around to cutting rates.
The point being that bottom for this market may be further out in time, and lower down in price, given this dynamic that rates are on the rise as the bear market unfolds. And thus stocks will not be that attractive compared to 5-7% risk free rate on Government bonds or 7-10% rates on high quality corporate bonds.
Happy Trades