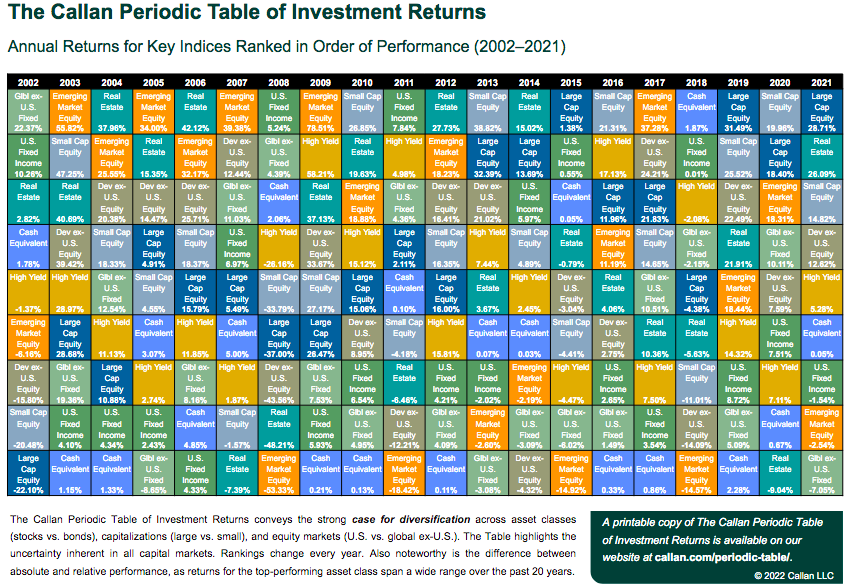
Periodic Table of Asset Class & Sector Performances
February, 22 2022
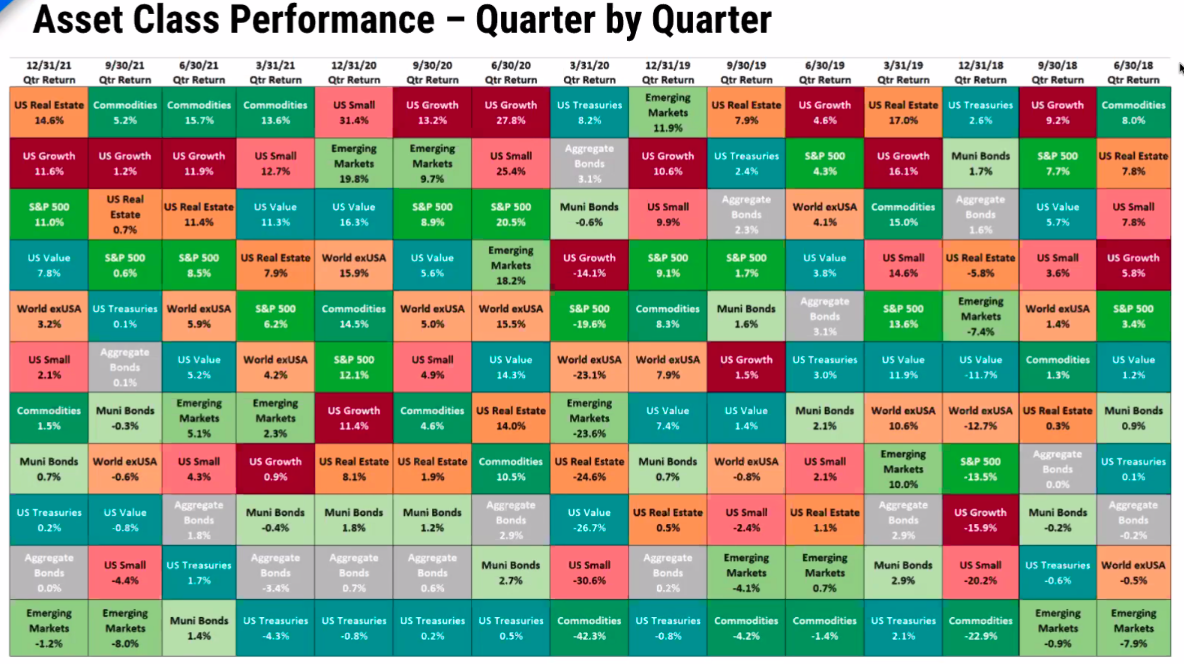
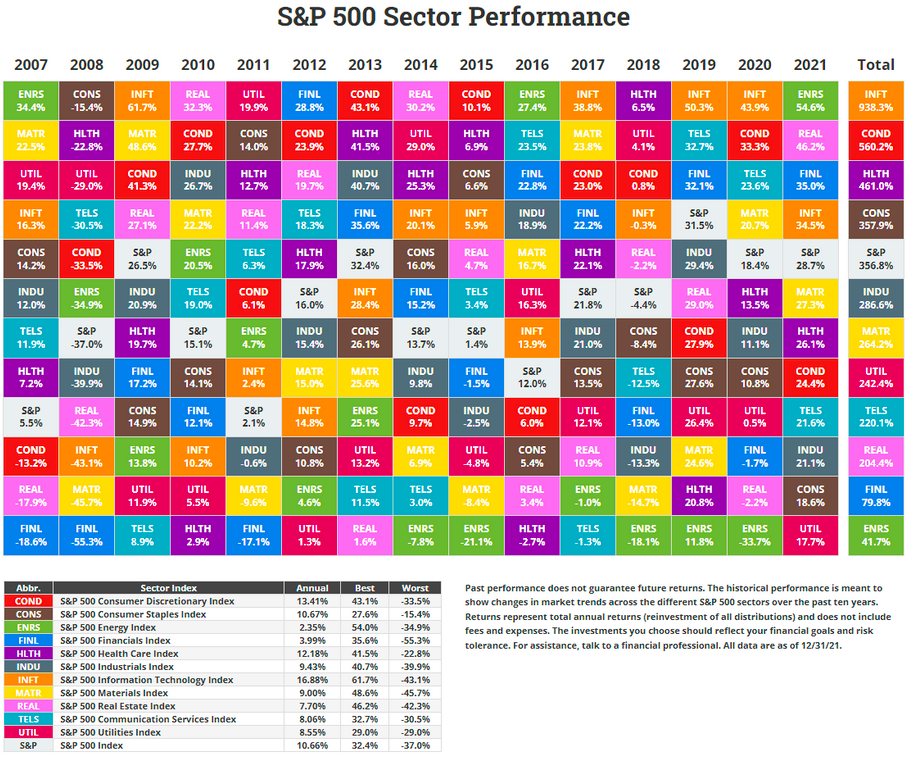
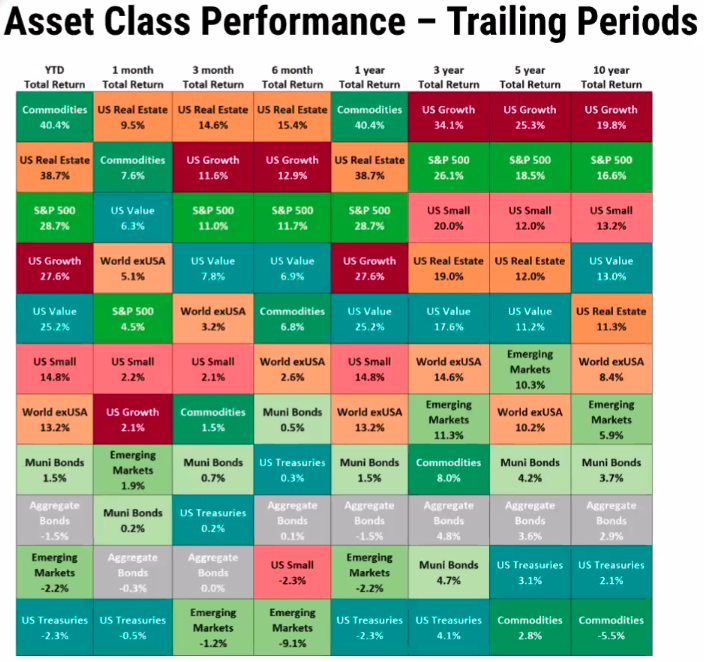
Below are recap tables of performances for different assets and sectors over the past years. We estimates we are more like in 2007 environment.

12/31/2021
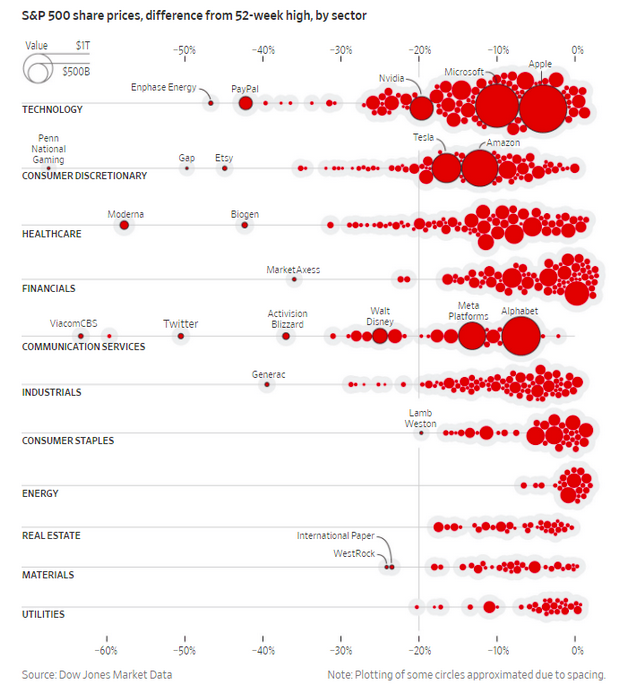
Giant Stock Swings Kick Off 2022 as of 01/17/2022