Weekly Market Review as of August 31
September, 02 2013Are the Markets Ready to Crash ?
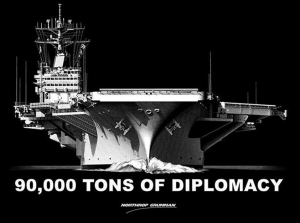 Syria tops the list of investor worries this week. President Obama appears (maybe not his public opinion) to have decided that a punitive military strike into Syria is justified. Perhaps so, but such a violent intervention further destabilizes the fragile geopolitics of the Middle East, and raises the risk of broadening the violence to the major oil production and shipment centers of the region. So economically, this raises the specter of a serious negative supply shock, fomenting potentially devastating turbulence in global financial markets and severe headwinds for an already sluggish global recovery.
In the US, both durable goods orders and pending home sales fell significantly in July. While the weak prints admittedly were not a definitive signal that the economic recovery was poised to lose momentum. Of course, it also provides more grounds for patience at the Fed, perhaps even pushing off the start to tapering until late this year, which could be good news for stocks and bonds.
Meanwhile, potential financial vulnerabilities of emerging economies (EM) are also capturing investors’ attentions. There has been frustration all year that major EM may not be regaining traction as quickly as expected, highlighted this week by India’s disappointing GDP print. But there is also growing concern that the Fed’s move towards tapering and eventually tightening policy could fuel destabilizing capital flows from EM, which could in turn significantly ratchet up the stress on financial markets already facing huge challenges from eventual monetary policy normalization. Indeed, there is increasing discussion of a possible EM crisis, the grave risk of which was highlighted at the Fed’s Jackson Hole conference this past weekend.
Asia/EM contagion into the Chinese economy, which has recently shown signs of stabilization, would clearly be a worry. While it is not yet a liquidity crisis that warrants global policy coordination, watch anything that causes another lurch lower in Chinese growth expectations. As in the Asia crisis of the 1990s, current account deficits are proving the Achilles Heel for Asia & Emerging Markets. The improvement in Peripheral European external balances was the catalyst for strong Mediterranean asset price performance in the past 12 months. Thatʼs now the model for EM to follow after this collapse in FX, stocks and bonds across the Southern Hemisphere (Chart below).
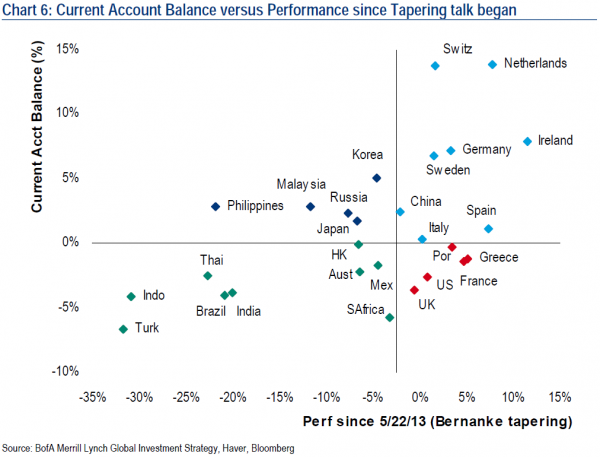
See Presentation at the end and our other EM article
Equities: Equities are broadly lower as worries over Syria, as well as US growth and EM financial stress, eroded risk appetites. Notably, EM equities are down over 12.0% on the year, near their lows of the last three years.
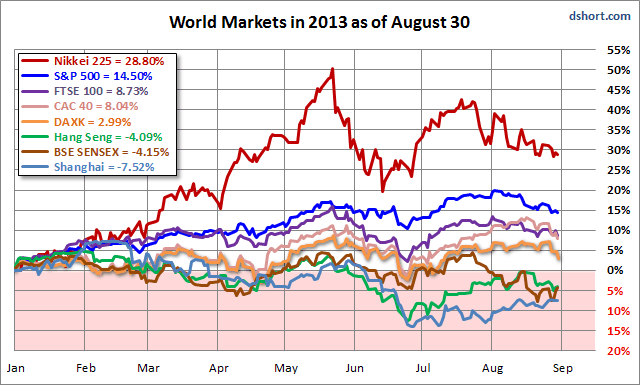
Since Friday was the last market day of August, we can also study the monthly comps for the eight indexes. The Shanghai was the only one to post a gain, and it was a substantial 5.25%. The second best performance was Hong Kong’s Hang Seng, which lost a mere 0.70%. A loss of 1.48% was enough for the French index to take the third spot. Two indexes lost fractionally more than two percent, and three indexes fell more than three percent, including the S&P 500, which posted its worst monthly close in 15 months.
Bonds: G7 government bonds are broadly bid on safe haven demand and perhaps a sense that poor US data may make the Fed a bit more patient on tapering. Italian yields alone were a bit higher; typical for the risk-off trade recently.
Currencies: USD and JPY were well bid on safe haven demand. Notably, AUD dropped below 0.90 for the second time this month, reaching for its lowest in three years. EUR tumbled to its lowest in a month.
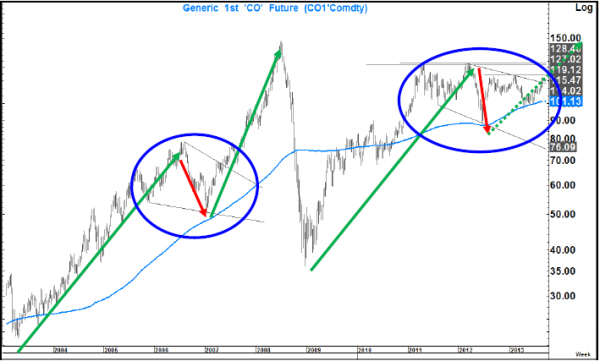
Commodities: Oil (Brent) surged to as much as $118 per barrel, its highest since February, on fears of a Western military strike against Syria. Any surge in Oil would have a very negative economic feedback loop. Oil, if anything, has a much quicker transmission mechanism into the economy than either monetary or fiscal policy, especially if the move is “speedy”
Right now the most obvious concern is the dynamic in Syria. This is not because Syria is a big Oil producer (It is not) but it is a country caught between the loyalties of Russia and Iran on one side and the US and Saudi Arabia on the other. An escalation here (At the same time as Egypt has become unstable again) would raise concerns about the danger of “spillover” effects. All that is before we even revisit the Iranian nuclear situation. -see Greater Middle East Energy War–
Even if we look at $185-190 as a stretch by year end (Albeit not beyond the realms of possibility) even a move back towards the all-time highs around $147 with:
- Unrest in the Middle East
- Financial stress in LM and in particular Asia
- Fiscal drag from the sequester and tax rises
- Debt limit/ budget negotiations
- Potential Fed tapering
- A new Fed Chairperson
- German elections
- Europe (Periphery etc.)
...would be a relatively instantaneous and in our view unbearable drag on the Global economy i.e. a game changer.
The Bear trend
Clear and Present Danger
We were due for a pullback, although we are convinced the Fed is bluffing. But time will tell. Recall Sept. 18 is the date of the next Federal Open Market Committee meeting. It’s also the square asterisked in pencil on every trader’s calendar — “Tapering starts today **tentative**” At July’s FOMC meeting, the Fed kicked around the idea of going back on its taper target (6.5% unemployment and 2.5% inflation). Ultimately, they stayed the course. That is, tapering in September unless they say otherwise come September.
C onflict (policy, military), R ates (liquidity), A sia, S peculation (forced selling) and H ousing are all potential catalysts for a much more contagious autumn market event. See BoAML ReportThe “Great Rotation” consensus is now under pressure. A “buyers strike” is suddenly visible in late August as investors see the potential for event risk in coming weeks. September is seasonally the weakest month of the year for risk assets and the S&P500 has not recorded an official “10%” correction in 2 years, so it is no surprise that US equities, in particular, are taking a bit of a breather here. But is there something more sinister at play than a healthy correction in risk assets?
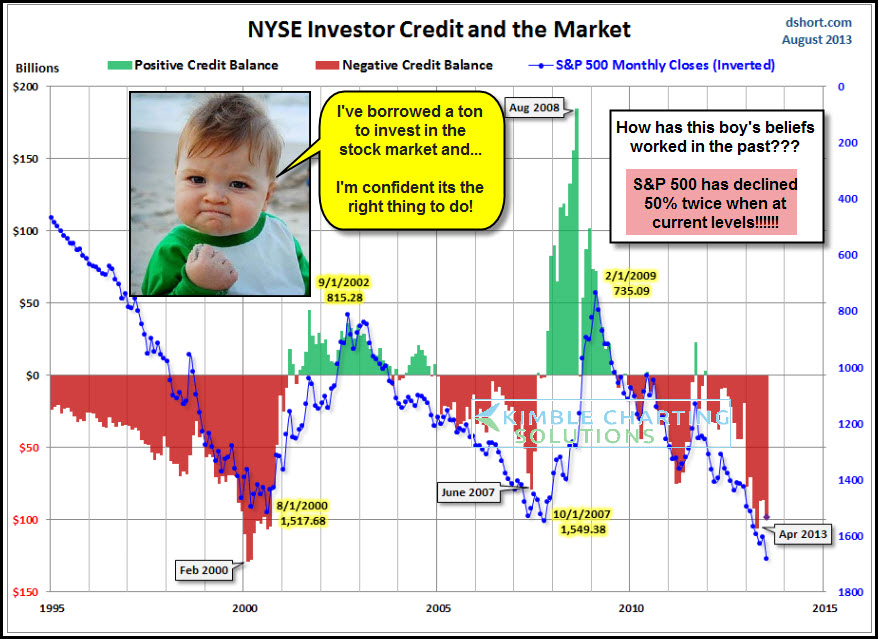
I don’t know if we’ve seen the worst of it yet. A friend I trust was telling me of his concern about the amount of margin debt out there. Investors have more margin debt now than they had in 2007, and we know how well that turned out. The below outstanding chart, created by Doug Short, reflects that margin debt remains near record levels.


