Weekly Market Review as of August 5
August, 05 2013The Wizards of QE

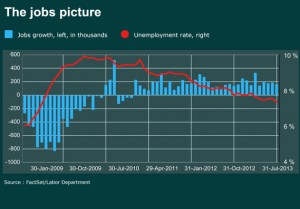
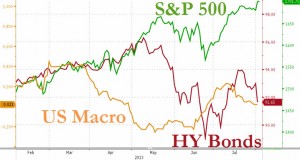
Even with a PMI beat in the US, macro is still sliding (though cognitively noone wants to discuss what is missing expectations)…But equity markets don’t care… all that matters was that the Fed began to lose control so in May, the BoJ stepped in and lifted equities away from reality just a little more… After strong data earlier in the week, the Labor Dpt on Friday said 162,000 jobs were created in July, and that the unemployment rate fell to 7.4%. That’s undeniable progress but somewhat short of market expectations. The jobs data wasn’t the only big piece of economic data in a busy week. The U.S.economy grew 1.7 % in the second quarter faster than many economists anticipated. However, the first quarter growth rate was revised lower.
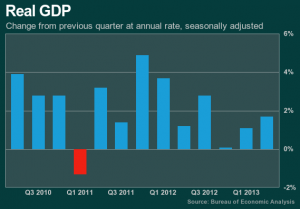
For the Fed, this involved highlighting the recent “modest pace” of growth, the potential headwinds from higher mortgage rates, and the downside risks to economic performance from inflation persistently below the 2.0% target. And if the dovish message wasn’t clear in this assessment, the Fed in the policy statement specifically “reaffirmed its view that a highly accommodative stance of monetary policy will remain appropriate for a considerable time after the asset purchase program ends and the economic recovery strengthens” . Following the charts below it is not yet clear that the economy is back on a growth track !
Federal Reserve punts, for now
A lively debate has broken out among economists about whether the Federal Reserve will decide to slow down the pace of its asset purchase plan in September or December. Fed Chairman has suggested only that the slowdown of purchases is likely “later this year.” The Federal Reserve releases a statement at the conclusion of each of its policy-setting meetings, outlining the central bank’s economic outlook and the actions it plans to take. Much of the statement remains the same from meeting to meeting. Fed watchers closely parse changes between statements to see how the Fed’s views are evolving.
The Fed hopes to enhance the probability of an orderly and gradual reduction in the institution’s experimental policies. Here are the three main things that the Fed told at the conclusion of his meeting: The U.S. economy continues to improve, though at a moderate pace with unemployment still too high; given the continued need for a “highly accommodative stance of monetary policy,” central bankers expect to keep policy interest rates low for a long time; and the economic outlook remains uncertain, including the balance between inflation and disinflation.
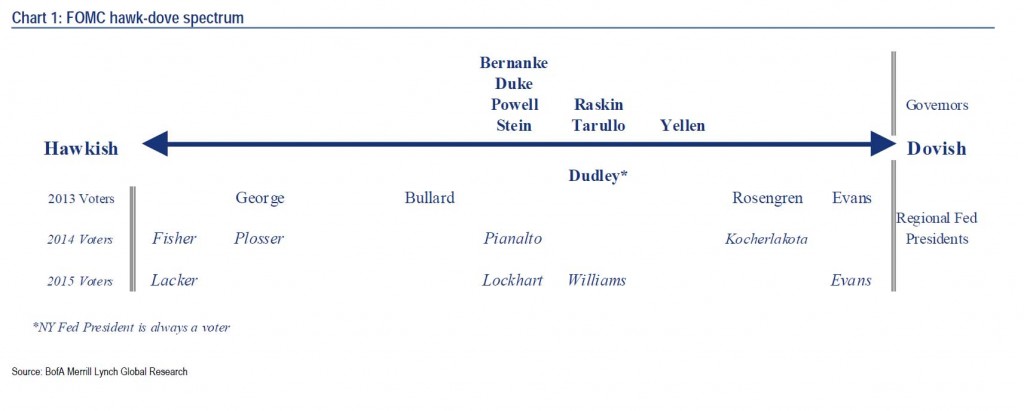
In September we may also have greater clarity on who will succeed Ben Bernanke at the helm of the world’s most powerful central bank. Accordingly, rather than be mesmerized by the Summers – Yellen media circus, investors could have a better handle on policy continuity at the one economic institution that has stepped up to its policymaking responsibilities in the U.S. All this makes the next Fed policy meeting a particularly important and tricky one. And it is not as if September was uncertainty-light to begin with.
Remember Europe? Virtually every key economic and financial decision there — whether national or regional — has been put on hold awaiting the outcome of German elections in September.
Moreover, in his press conference, President Draghi reinforced the dovish signal by opining that any expectations of rate hikes in monetary markets are unwarranted. This push-back on market expectations was similar to those provided by the BoE last month. And while the BoE didn’t repeat this message to markets this week, we expect to see explicit dovish forward guidance on rates forthcoming from the Old Lady as soon as next Wednesday.
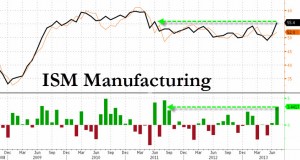
Equities:Markets were mostly higher this week. Notably, the US benchmark S&P 500 stretched above 1,700 for the first time, having just broken through the 1,600 threshold for the first time in May. The US equity rally was bolstered by dovish signals from the Fed and an upbeat US manufacturing PMI, but faced some headwinds from the disappointing jobs print. The dovish ECB and improving PMIs also bolstered European equities. The Nikkei actually led the week’s gains in spite of a big drop in industrial production for June.
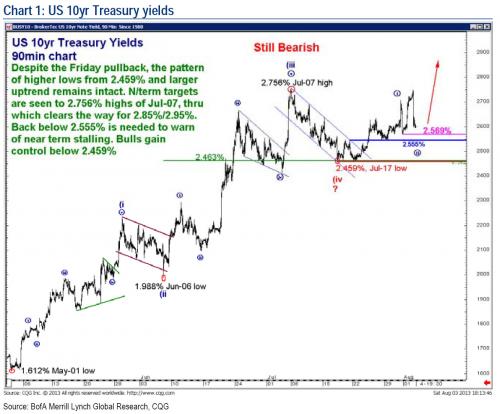
The Treasury Bear trend remains intact Friday’s very disappointing non-farm payroll number may have had zero impact on stocks, which after opening deep in the red, following the latest Fed-induced all day zero volume ramp, closed at all time high, but it sure worked miracles on the 10 Year to keep it from tumbling below the critical 2.75% level. Yet does Friday’s move change anything in the Ten-Year Trendline? According to Bank of America technical strategist MacNeil Curry, not at all.
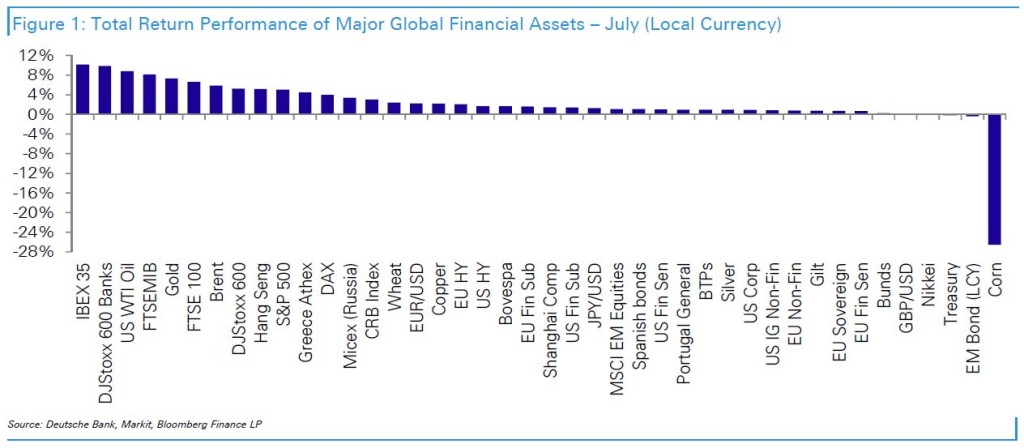
Commodities: Oil traded largely sideways this week. It caught a bid following the Fed on Wednesday, which was reinforced by the good PMIs on Thursday. But the bid faded on Friday following the lackluster US jobs print. Gold’s impressive July rally lost steam this week.
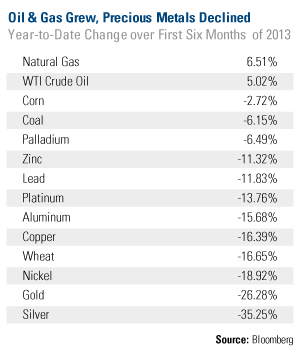
It was a challenging first half of the year for most commodities, with only two resources rising in value. Natural gas and oil rose 6.5 percent and 5 percent, respectively, while silver lost a third of its value and gold lost a quarter of its price from the beginning of the year. At first glance, the correction seems to support naysayers who believe the supercycle in commodities has ended, such as Credit Suisse analysts, who had declared that the “era is over,” in its digital magazine, The Financialist.
Getting Technical : Investors Not Committing to Rally
The Rydex Cash FLow Ratio is one sentiment indicators and currently it is showing that investors are unusually reluctant to commit money to the current rally. The Rydex Cash Flow Ratio gives an improved view of sentiment extremes by using cumulative cash flow (CCFL) into Rydex mutual funds rather than using the totals of assets in those funds (which we use for the Rydex Asset Ratio). It is calculated by dividing Money Market plus Bear Funds CCFL by Bull Funds plus Sector Funds CCFL.
After reaching the bullish edge of the Ratio scale at the May market top, we can see how sentiment became quite bearish during the June correction. The July rally has taken the market to new, all-time highs, but, so far, investors have been holding back.
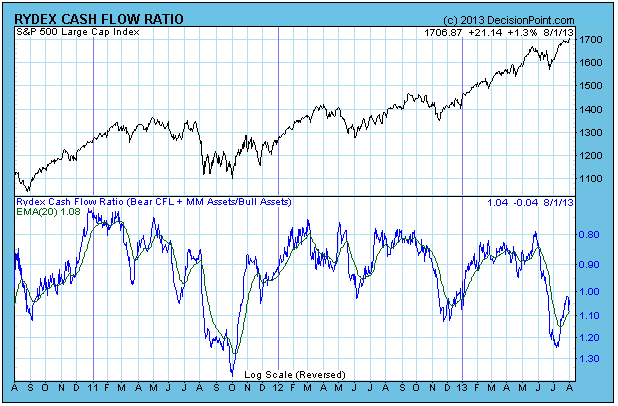
Analyzing the data more closely, we can see that cash flow into bull and sector funds has not been enthusiastic, and bear fund cash flow shows that the bears have not yet capitulated. A note of encouragement is that the rally is not that old — if it continues, positive cash flow could quickly catch up.
Conclusion : The Rydex Cash Flow Ratio shows that investors abandoned the market during the June correction, more than the size of the correction ultimately warranted. Their reluctance to commit to the rally may be simply a case of not enough time for sentiment to change, and a reflection of how the “wall of worry” works. But in the end, money must be committed to the market to push prices higher, and so far, that isn’t happening to any large degree.
Secular Bull and Bear Markets
Was the March 2009 low the end of a secular bear market and the beginning of a secular bull? Without crystal ball, we simply don’t know.
One thing we can do is examine the past to broaden our understanding of the range of possibilities. An obvious feature of this inflation-adjusted is the pattern of long-term alternations between up-and down-trends. The blue shows secular trends that lead to new all-time real highs. Periods in between are secular bear markets, regardless of their cyclical rallies.
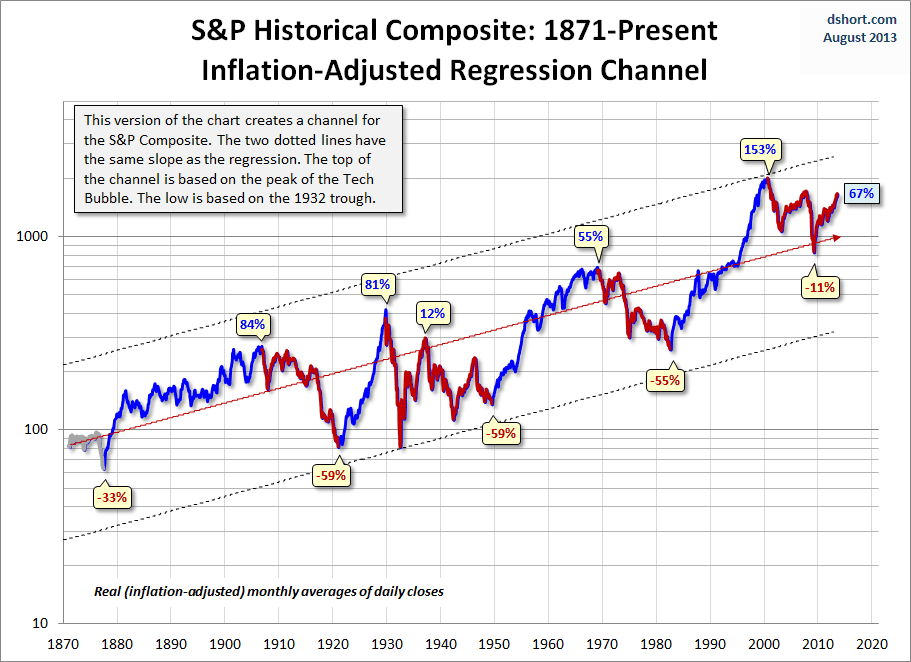
Historically, regression to trend often means overshooting to the other side. The latest monthly average of daily closes is 67% above trend after having fallen only 11% below trend in March of 2009. Previous bottoms were considerably further below trend.
Will the March 2009 bottom be different? Only time will tell.
Gold Update
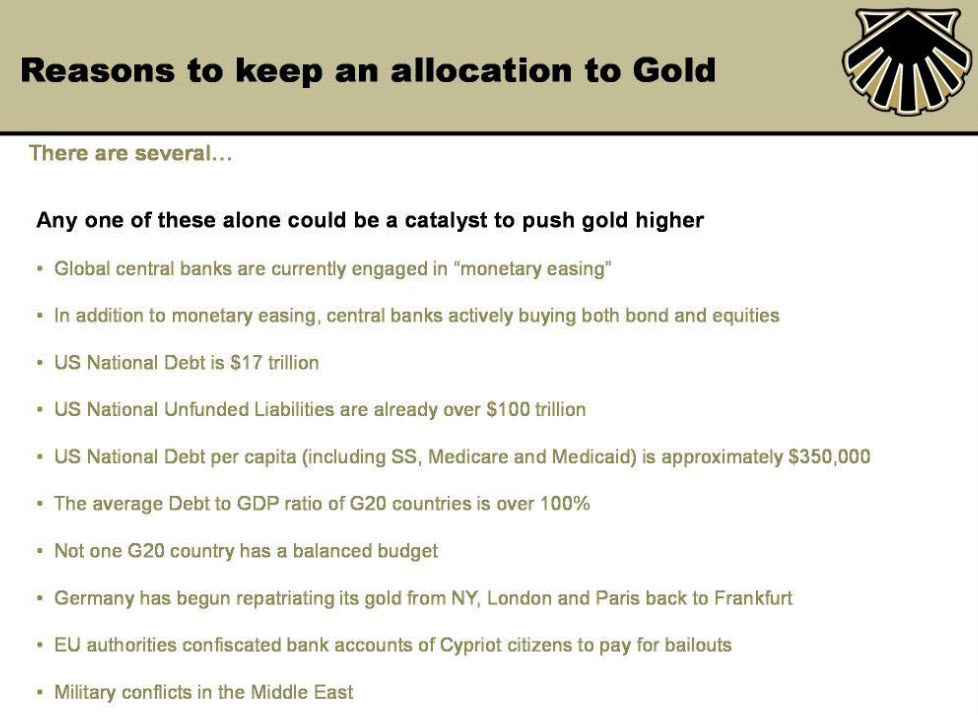
The demand for gold bullion is clearly increasing, while the prospects of supply are declining. Hence, the rules of economics at the most basic level would suggest the price of gold bullion will increase. Outside of old-fashioned economics, we are seeing too much negativity towards gold bullion. And when investor negativity towards any investment is so great, the price of the investment usually goes in the opposite way. SEE Is Gold Set for an Explosive Rebound?
I remain bullish on gold bullion. I don’t see any reason to be even slightly bearish at these low prices.
On the supply side, as gold prices have fallen, gold miners have cut back on their spending on exploration for more gold bullion.
Mining giants like the Agnico-Eagle Mines Limited have started to slash their exploration spending. Other gold mining giants are making similar moves, cutting back on their exploration spending.
Gold Stocks Bull Market Rebirth
See Gold Mines
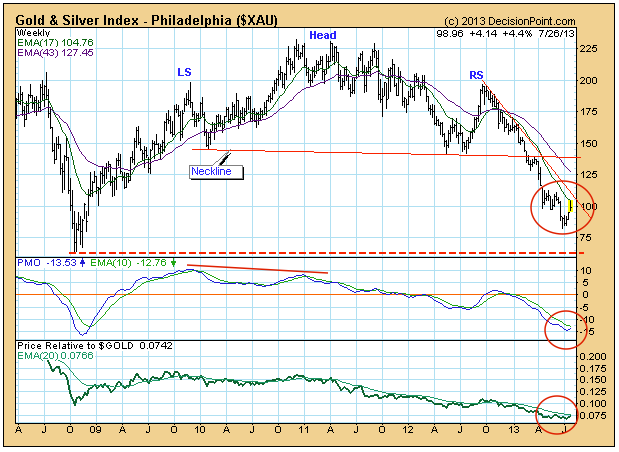
According to Charles Swenlin the first obvious feature is the head and shoulders pattern, which executed when price dropped below the neckline. At that point our minimum downside target would be equal to the distance between the top of the head and the neckline, which is somewhere south of the horizontal line drawn across the 2008 low. Note that there is a PMO (price momentum oscillator) negative divergence relative to the left shoulder and the head — a non-confirmation of the price high. The fact that the PMO has bottomed implies that the rally could go well beyond the declining tops line of resistance.
Conclusion : The XAU is firming relative to gold, and the very oversold PMO bottom indicates that significant gains could be made before the rally ends; however, the head and shoulders downside target has not been realized, and there is significant overhead resistance to be overcome. There is no basis for assuming that the long-term outlook has turned positive, only less negative.
